
News
To help investors keep up with the markets, we present our ETF Scorecard. The Scorecard takes a step back and looks at how various asset classes across the globe are performing. The weekly performance is from last Friday’s open to this week’s Thursday close.
- The U.S. Federal Reserve hiked interest rates by another 25 basis points to 2.25%, its third increase this year, in a widely expected move. The Fed said the U.S. economy is strong and the gradual return to a normal monetary policy provides support. Another hike is expected in December and three additional ones in 2019. The rising interest rates have displeased U.S. President Donald Trump, who said he is “not happy” to see the Fed hike rates again.
- U.S. final GDP for the second quarter was confirmed at 4.2% growth, largely in line with expectations.
- U.S. durable goods orders surged 4.5% in August, although new orders for nondefense capital goods dropped 0.5% due to a decline in demand for computers and electronic products.
- Several European purchasing managers’ indexes showed that manufacturing activity is slowing, while the services sector remains robust. Europe-wide flash Manufacturing PMI continued to fall in September to 53.3, the worst showing this year. At its peak in December 2017, the manufacturing PMI stood at 60.6.
- The picture in the services sector is more nuanced, with the PMI rising slightly to 54.7 in September.
- U.S. consumer confidence is booming, coming in at 138.4 in September versus expectations of 132.2. The figure for the prior month was revised up to 134.7.
- Crude oil inventories rose for the first time in six weeks for the five-day period ended September 21. Analysts had expected a fall of 0.7 million barrels, but stockpiles advanced by 1.9 million.
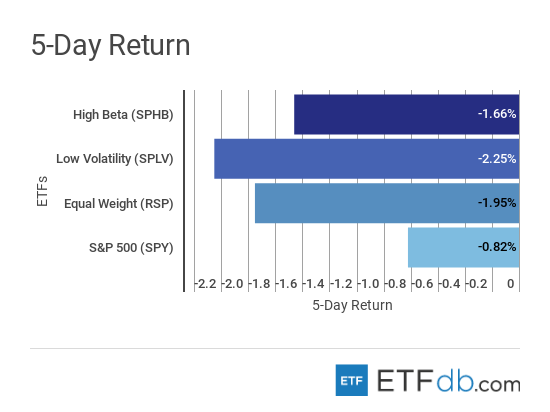
Risk Appetite Review
- The markets were down this week.
- Low volatility (SPLV ) was surprisingly the worst loser for the week, down 2.25%.
- The broad market (SPY ) fell 0.82%, representing the best performance from the pack.
- Risky assets (SPHB ) declined 1.66%.
- Sign up for ETFdb.com Pro and get access to real-time ratings on over 1,900 U.S.-listed ETFs.
Content continues below advertisement
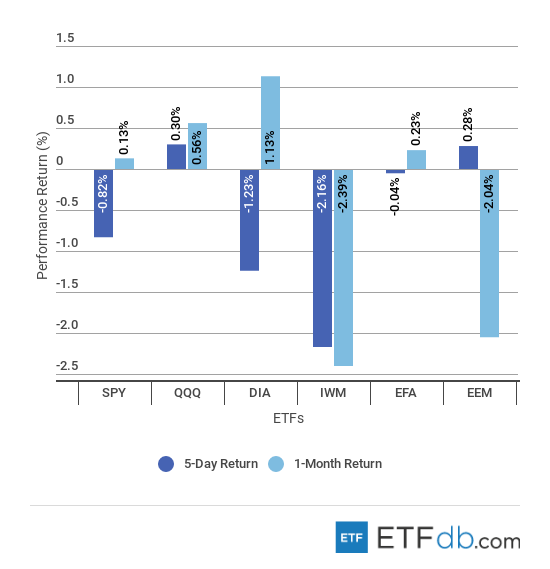
Major Index Review
- Major indexes were mixed.
- Technology equities (QQQ ) have acted as a safe haven in this mini-selloff, rising 0.30%.
- Meanwhile, small-cap stocks (IWM ) recorded the biggest losses for the week and the rolling month, down 2.16% and 2.39%, respectively. (IWM ) performed extremely well this year, beating its large-cap peers, but the bull run may have reached an end.
- Dow Jones (DIA ) claimed the crown of the best monthly performer for three weeks in a row. (DIA ) is up 1.13% for the past 30 days.
- To see how these indices performed a week before last, check out ETF Scorecard: September 21 Edition.
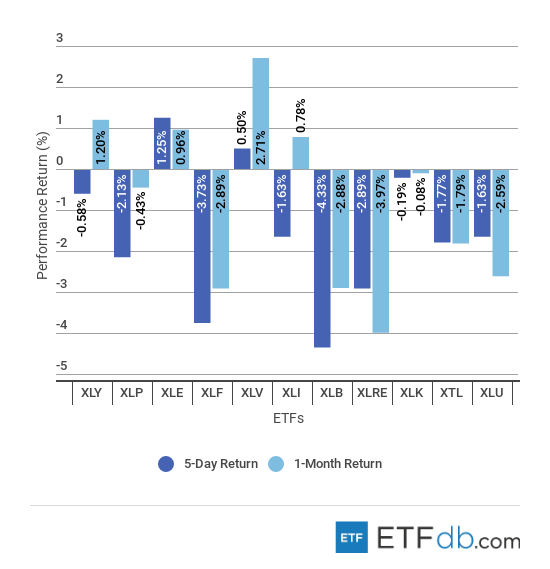
Sectors Review
- The energy sector (XLE ) was the best performer this week, partly thanks to rising oil and gas prices. (XLE ) rose 1.25%.
- Materials (XLB ) declined as much as 4.33% for the week, but real estate (XLRE ) is the worst performer for the rolling month with a drop of nearly 4%.
- Gainers for the rolling month were rare, with the healthcare sector (XLV ) the healthiest, up 2.71%.
- Use our Head-to-Head Comparison tool to compare two ETFs such as (XLF ) and (XLRE ) on a variety of criteria such as performance, AUM, trading volume and expenses.
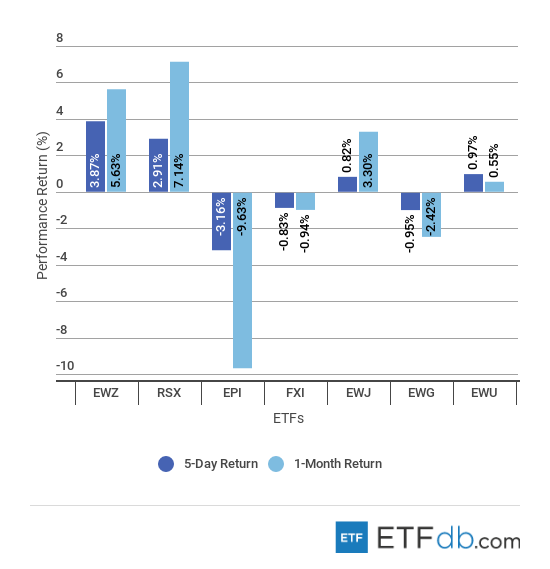
Foreign Equity Review
- Brazil (EWZ ) is continuing its recovery, surging 3.87% after a gain of 5.6% in the prior week, amid big volatility as the outcome of a presidential election remains uncertain.
- India (EPI ) is again the worst performer for the week with a drop of 3.16%, as investors were spooked by a potential default of a systemically important shadow bank. Unsurprisingly, (EPI ) is also the worst performer for the rolling month, down nearly 10%.
- While most markets are tumbling, Russia (RSX ) is thriving. (RSX ) is the best performer for the rolling month, up 7.14%.
- To find out more about ETFs exposed to particular countries, use our ETF Country Exposure tool. Select a particular country from a world map and get a list of all ETFs tracking your pick.
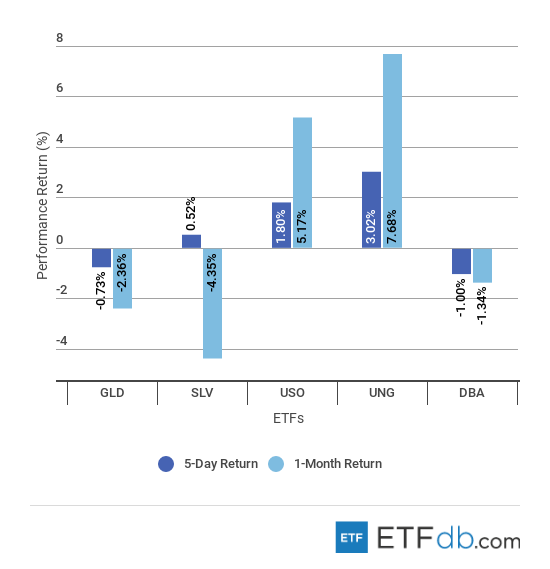
Commodities Review
- With a jump of 3% thanks to rising demand and cold weather, natural gas (UNG ) is the best performer for the week. (UNG ) advanced 7.68% for the past 30 days, claiming the title of the best monthly performer.
- The agricultural fund (DBA ) lost 1% this week, the worst performer.
- Due to heavy losses in previous weeks, silver (SLV ) remains the worst performer for the rolling month with a decline of 4.35%.
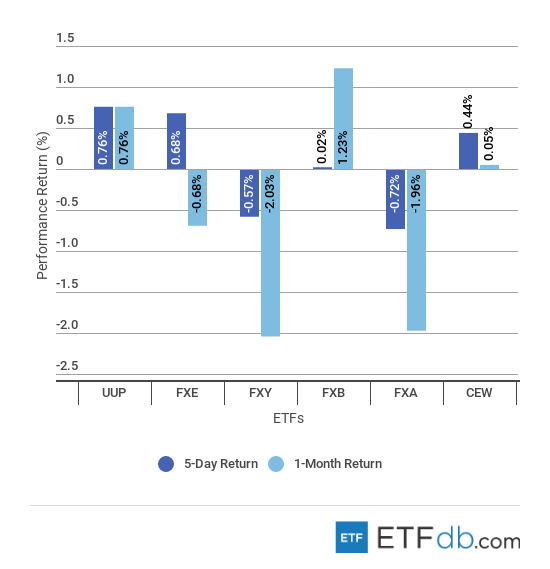
Currency Review
- The U.S. dollar (UUP ) jumped 0.76% in the past five days, as the Federal Reserve hiked interest rates and signaled another rise by the end of the year.
- The Australian dollar (FXA ) fell 0.72%, representing the worst performance for the week.
For more ETF news and analysis, subscribe to our free newsletter.
Disclosure: No positions at time of writing.

