
To help investors keep up with the markets, we present our ETF Scorecard. The Scorecard takes a step back and looks at how various asset classes across the globe are performing. The weekly performance is from last Friday’s open to this week’s Wednesday close.
- With the U.S. markets closed Thursday for Thanksgiving and the overall holiday atmosphere this week, attention turned to Europe.
- European Central Bank President Mario Draghi said policymakers were ready to change the interest rate path if inflation slows. The current scenario is that ECB will end its bond purchase program in December and start raising interest rates next summer for the first time in eight years. But the ECB may change its course and keep interest rates lower for longer.
- The U.K. and the European Union agreed on a draft declaration for the Brexit deal, with Britain maintaining access to its crucial EU market, while at the same time ending free movement. However, until the new bilateral relationship is agreed upon, Britain will be bound to European rules without having a say. Critics fear Britain will remain trapped in the single market indefinitely, but markets cheered the progress made.
- Bank of England Governor Mark Carney warned investors that volatility in the British pound is set to continue going forward, largely blaming Brexit. On the potential for a no-deal Brexit, Carney indicated big uncertainty stemming from a large supply shock.
- In the U.S., core durable goods orders rose by 0.1% in October, well below estimates of 0.4%. The showing has been rather weak for three months in a row, likely an indication of the fragile business sentiment and trade war fears.
- Meanwhile, U.S. unemployment claims unexpectedly came in at 224,000, the biggest number since July. Analysts had expected a showing of 215,000.
- Crude oil inventories rose as much as 4.9 million barrels for the week ended November 15, the ninth consecutive weekly increase. The buildup in inventories has sent shockwaves through oil markets, with the black commodity dropping dramatically.
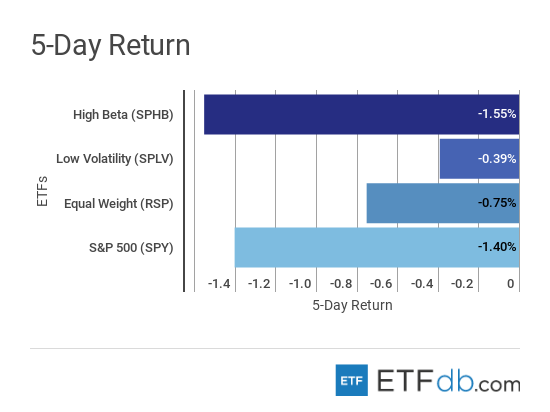
Risk Appetite Review
- In the Thanksgiving week, markets were in decline.
- The broad market (SPY ) shed 1.4% of its value during the short week, the second-worst performance after risk assets (SPHB ), which dipped 1.55%.
- Low volatility (SPLV ) was the best performer with a drop of just 0.39%.
Sign up for ETFdb.com Pro and get access to real-time ratings on over 1,900 U.S.-listed ETFs.
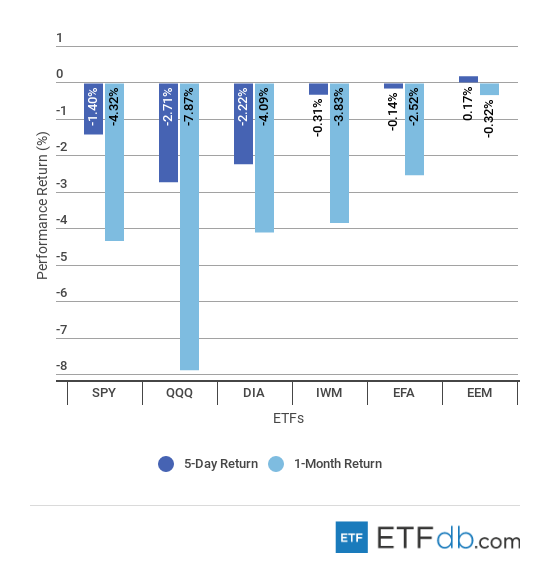
Major Index Review
- Amid a bloodbath in Western markets, emerging markets managed to post a gain, however small. (EEM ) edged up 0.17% for the week and is also the best performer for the rolling month, down just 0.32%.
- Technology stocks (QQQ ) suffered the most in this market rout, losing 2.71% in the four days through Wednesday. FAANG stocks, which include Facebook (FB), Apple (AAPL) and Amazon (AMZN), led the losses. For the rolling month, (QQQ ) posted the biggest decline, down 7.87%.
To see how these indices performed a week before last, check out ETF Scorecard: November 16 Edition.
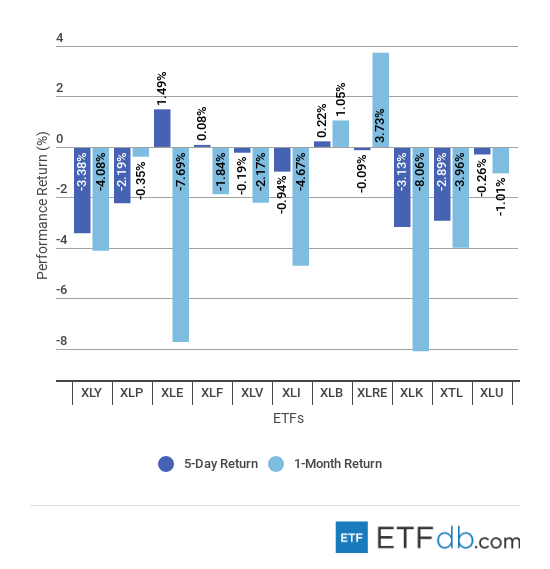
Sectors Review
- The consumer discretionary and technology sectors were the biggest losers this week, with (XLY ) declining 3.38% and (XLK ) losing 3.13%.
- For the rolling month, the tech sector is the worst performer, close to the energy sector, which experienced severe bouts of volatility recently.
- The best performer for the week is the energy sector. (XLE ) rose 1.49%, largely thanks to surging gas prices.
- For the rolling month, the real estate sector (XLRE ) remains the best performer, up as much as 3.73%.
Use our Head-to-Head Comparison tool to compare two ETFs such as (XLK ) and (XLRE ) on a variety of criteria such as performance, AUM, trading volume and expenses.
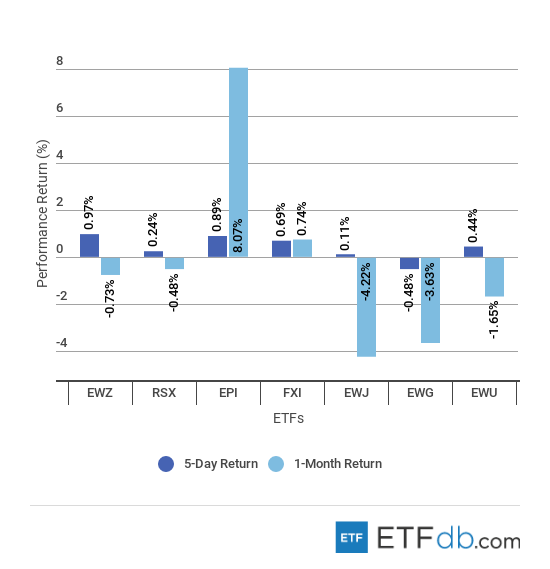
Foreign Equity Review
- Brazil (EWZ ) gained nearly 1% for the past week, but it remains down 0.73% for the rolling month, as volatility in the country’s stock market dropped consistently.
- Germany (EWG ) was the only loser this week, dropping 0.48%.
- Japan (EWJ ) continues to be the worst performer for the rolling month, down 4.22%.
- Meanwhile, India’s stock market (EPI ) experienced a spectacular rebound, skyrocketing more than 8% for the rolling month.
To find out more about ETFs exposed to particular countries, check out our ETF Country Exposure tool. Select a particular country from a world map and get a list of all ETFs tracking your pick.
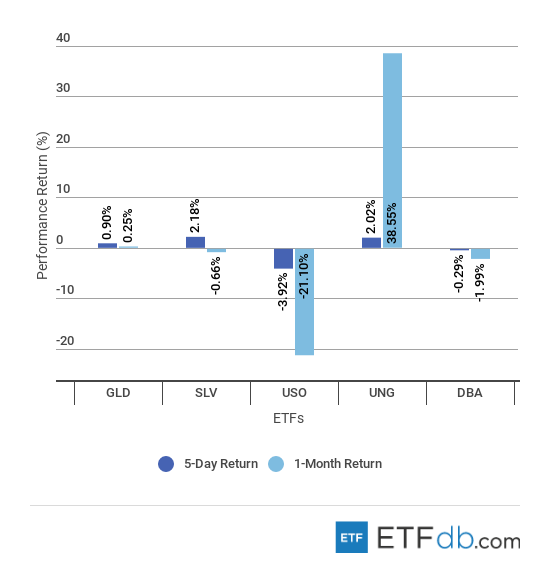
Commodities Review
- Silver (SLV ) gained 2.18%, becoming the best performer for the week and matching the performance of natural gas (UNG ), which is up 2.02%.
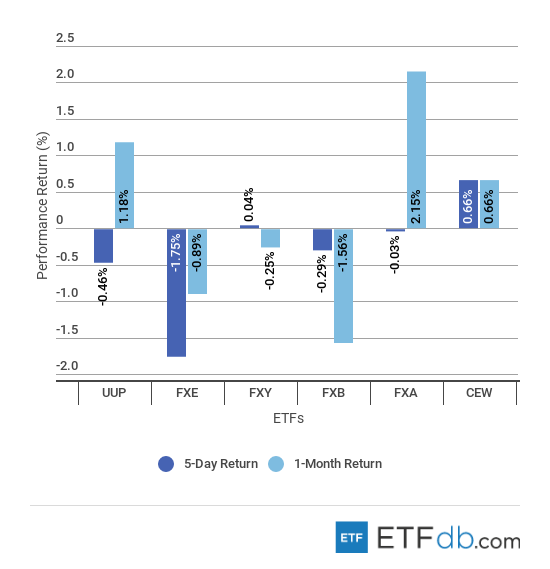
Currency Review
- The European shared currency (FXE ) declined 1.75% for the week, continuing to be the worst performer.
- Emerging market currencies (CEW ) gained some ground this week, rising 0.66%.
For more ETF analysis, make sure to sign up for our free ETF newsletter.
Disclosure: No positions at time of writing.

