
To help investors keep up with the markets, we present our ETF Scorecard. The Scorecard takes a step back and looks at how various asset classes across the globe are performing. The weekly performance is from last Friday’s open to this week’s Thursday close.
- China and the U.S. have agreed on a temporary truce in their ongoing trade war. The parties will hold off any additional tariffs for 90 days while they try to negotiate a definitive deal. The prospect of an agreement is high given the NAFTA precedent. However, relations soured again after the U.S. ordered the extradition of Huawei’s chief financial officer Meng Wanzhou, the daughter of the company’s founder.
- The unemployment rate in the Eurozone stood flat at 8.1% in November, despite analysts expecting a drop of ten basis points.
- U.S. manufacturing sentiment rose in December to a two-month high of 59.3, beating forecasts of 57.5.
- OPEC was unable to agree on the amount of cut to oil production on Thursday to contain the sell-off in the commodity. A new meeting will take place Friday, when Russia, a non-OPEC heavyweight producer, will join the discussions.
- The OPEC meetings come as oil finally got a bit of hopeful news. U.S. stockpiles dropped by 7.3 million barrels for the week ended November 30, finally reversing ten weeks of the expansion.
- ADP said the U.S. economy added 179,000 jobs in November, a pretty strong report despite analysts expecting an addition of 200,000. In the prior month, ADP said the economy generated 225,000 jobs.
- Unemployment claims, meanwhile, are slowly rising. For the week ended December 1, claims stood at 231,000, down from 235,000 in the prior week. The figure is still hovering around six-month highs.
Risk Appetite Review
- Markets sold off this week.
- Risk assets (SPHB ) were hit the most from the pack, declining more than 2%.
- The broad market itself (SPY ) fell 1.45%.
- The best performer is low volatility (SPLV ), with an advance of 0.14%.
Sign up for ETFdb.com Pro and get access to real-time ratings on over 1,900 U.S.-listed ETFs.

Major Index Review
- Emerging markets (EEM ) were the surprising best performer for the week, collectively dropping just 0.78%. A thaw in relations between the U.S. and China and a potential deal to cut oil supply to support the market has made the index a temporary safe haven. Indeed, (EEM ) is also the best performer for the rolling month, with a small drop of 0.22%.
- Meanwhile, Russell 2000 (IWM ), the small-cap stock index, was the worst performer both for the week and the rolling month, down 2.81% and 4.2%, respectively.
To see how these indices performed a week before last, check out ETF Scorecard: November 30 Edition.

Sectors Review
- The real estate sector (XLRE ) was among the few industries that performed well in the current market sell-off, beating its peers both for the week and the rolling month. (XLRE ) is appealing to investors given its steady flows of income and relative stability in the current turbulent environment.
- The financial sector was the worst performer for the week, with (XLF ) declining 4.3%. Banks are expected to suffer from the flattening of the yield curve as they borrow at short-term periods and lend for longer periods.
- For the rolling month, the energy sector (XLE ) remains the worst performer with a decline of 6.43%, weighed down by oil.
Use our Head-to-Head Comparison tool to compare two ETFs such as (XLE ) and (XLF ) on a variety of criteria such as performance, AUM, trading volume and expenses.

Foreign Equity Review
- Foreign equities were mostly down.
- Russia (RSX ) reported the best performance for the week, advancing 0.78%, as hopes for a deal with Saudi Arabia to cut oil production is high.
- India (EPI ) tumbled nearly 3%, after weeks of solid performance. Indeed, India remains the best performer for the rolling month.
- Britain (EWU ), meanwhile, is the worst performer for the past 30 days, as investors fear chaos will ensue if Parliament rejects a Brexit deal with the European Union.
To find out more about ETFs exposed to particular countries, check out our ETF Country Exposure tool. Select a particular country from a world map and get a list of all ETFs tracking your pick.

Commodities Review
- Oil (USO ) was the best performer for the week, rising nearly 3% on hopes OPEC and Russia will strike a deal to cut production. Still, the black commodity remains the worst performer for the rolling month, down 18.3%.
- Natural gas (UNG ), meanwhile, reversed some of the gains from the previous week and is now the worst performer from the pack, down nearly 5%. Natural gas retained its crown of the best monthly performer, though, rising 20% for the past 30 days.

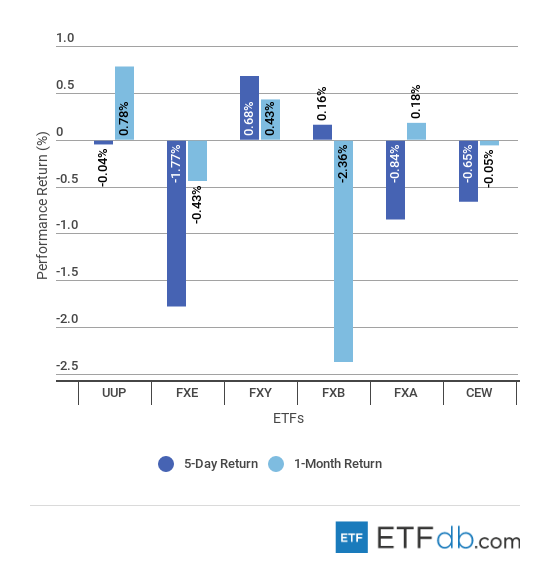
Currency Review
- The Japanese yen (FXY ) rose 0.68% for the week, as it benefited from its strong safe-haven appeal.
- The European shared currency (FXE ) is again the worst weekly performer, with a drop of 1.77%.
For more ETF analysis, make sure to sign up for our free ETF newsletter.
Disclosure: No positions at time of writing.

