ETFdb Logo
ETFdb Logo
  • ETF Database
  • Channels
    • Themes
      • Active ETF
      • Artificial Intelligence
      • Beyond Basic Beta
      • China Insights
      • Climate Insights
      • Core Strategies
      • Crypto
      • Direct Indexing
      • Disruptive Technology
      • Energy Infrastructure
      • ETF Building Blocks
      • ETF Investing
      • ETF Education
      • ETF Strategist
      • Financial Literacy
      • Fixed Income
      • Free Cash Flow
      • Innovative ETFs
      • Institutional Income Strategies
      • Leveraged & Inverse
      • Managed Futures
      • Market Insights
      • Modern Alpha
      • Multifactor
      • Responsible Investing
      • Retirement Income
      • Tax Efficient Income
    • Asset Class
      • Equity
        • U.S. Equity
        • Int'l Developed
        • Emerging Market Equities
      • Alternatives
        • Commodities
        • Gold/Silver/Critical Minerals
        • Currency
        • Volatility
      • Fixed Income
        • Investment Grade Corporates
        • US Treasuries & TIPS
        • High Yield Corporates
        • Int'l Fixed Income
    • ETF Ecosystem
    • ETFs in Canada
  • Tools
    • ETF Screener
    • ETF Country Exposure Tool
    • ETF Sector Tracker Tool
    • ETF Database Categories
    • Head-To-Head ETF Comparison Tool
    • ETF Stock Exposure Tool
    • ETF Issuer Fund Flows
    • Indexes
    • Mutual Fund To ETF Converter
  • Research
    • ETF Education
    • Equity Investing
    • Dividend ETFs
    • Leveraged ETFs
    • Inverse ETFs
    • Index Education
    • Index Insights
    • Top ETF Sectors
    • Top ETF Issuers
    • Top ETF Industries
  • Webcasts
  • Themes
    • AI ETFs
    • Blockchain ETFs
    • See all Thematic Investing ETF themes
    • ESG Investing
    • Marijuana ETFs
  • Multimedia
    • ETF 360 Video Series
    • ETF of the Week Podcast
    • ETF Prime Podcast
    • Video
  • Company
    • About VettaFi
    • Get VettaFi’ed
  • PRO
    • Pro Content
    • Pro Tools
    • Advanced
    • FAQ
    • Pricing
    • Free Sign Up
    • Login
  1. Is the Fed’s ETF Work Complete?
News
Share

Is the Fed’s ETF Work Complete?

Dave NadigSep 21, 2020
2020-09-21

As a matter of course, I’m used to examining flows into ETFs to get some insight into investor sentiment. It’s a far from perfect proxy. After all, when we say “XYZ fund had $1 million in flows” we’re not saying “Bob and Alice bought $1 million! Sentiment!” What we’re saying is that there was enough of a disconnect between the price Bob and Alice were willing to pay and the fair value of XYZ for an Authorized Participant to go through the hassle of making new ETF shares: buying up underlying securities, turning them into the issuer, and getting new shares to sell. That’s the mechanics.

Still, as low-frequency data goes, I think it’s useful (as high-frequency data, say, daily, it can be full of noise, which is why I will shout from the rooftops not to use flows as “signal” until I’m blue in the face.)

So what do flows tell us? Here’s the chart of Year-to-Date and Quarter-to-Date flows.

All US ETFs by Asset Class

Content continues below advertisement

On the surface we can glean a few quick things here: First, the overall flows of $284 million are stellar. We’re basically on track to meet or beat the best year ever for ETF flows ($452 million in 2017). But that really just tells us what we already know: in times of volatility, people ditch their underperforming traditional active mutual funds and buy low-cost ETFs when they decide to re-enter the market. It’s happened in every downturn since the dotcom bubble burst.

Perhaps more interesting is the mix here: Investors strongly favored domestic equities until quite recently, when they reallocated strongly into international equities. Commodities have remained strong all year, driven primarily by $37 billion in new money going into Gold ETFs, and another $8 billion into oil.

But by far the most interesting spin is how investors have strongly favored fixed income, and that trend has continued nearly unabated month after month. But this ain’t advisors building bond ladders, it’s much more interesting than that:

Fixed Income ETFs Chart

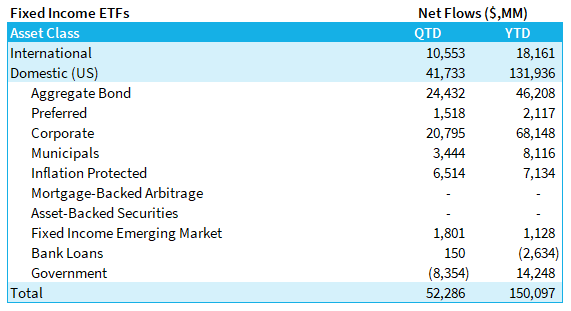
The Aggregate Bond allocations make sense — that’s just investors parking cash into default ETFs. The $68 billion into corporates, however, is in my recollection unprecedented since Bond ETFs first became a thing in the early 2000s.

And I know what you’re thinking: “Dave, this is all the Fed! They’re buying corporate bond ETFs!!” But it doesn’t quite match. The Fed’s Secondary Market Corporate Credit Facility didn’t kick into gear until well into May — as of their April report it was still not operational. So let’s look at what the fed actually owns, as of the end of August, and how that compares to the flows for those funds:

Fed August Flows Chart

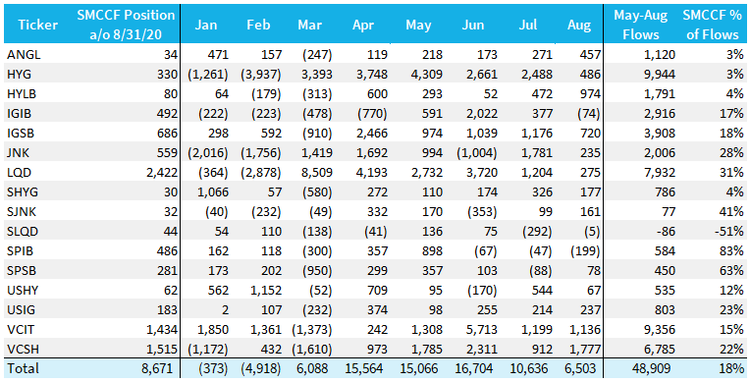
I’ve included the flows for the full year just to help tell the story. As of the end of August, the SMCCF owned $8.6 billion in 16 listed funds. In March, when the SMCCF was announced, money started coming into the “default” ETFs in the space and by April we were in full on “buy everything” mode across the complex. And while the Fed has indeed been a bit of a whale in some of the smaller funds, in aggregate, the fed has only been responsible for 18% of the flow since the program started.

More importantly, the Fed seems to have completely stopped buying. The August report shows no new transactions in corporate bond ETFs whatsoever. And yet, the Fed-16 continue to gain assets.

My conclusion: the Fed did exactly what it wanted to do here — buying just enough on the open market to convince the street that they would be the buyer of first and last resort, and bringing investors along for the ride. Whether this is good, bad or indifferent from a moral hazard and price discovery perspective will have to be settled over the long game. But short term? You’d have to say mission accomplished.

This article originally appeared on ETFTrends.com.

» Popular Pages

  • Tickers
  • Articles

Sep 29

A Fixed Income Primer for Constructing Portfolios

Sep 29

Main Management Market Note: September 29, 2023

Sep 29

Higher for Much Longer?

Sep 29

Moving Averages: S&P Ends September Down 4.9%

Sep 29

This Week in ETFs: FormulaFolios Renamed & Adds New Funds

Sep 29

Play Online Car Sales News in These 2 China ETFs

Sep 29

SEC Opens Ethereum Futures ETF Floodgates

Sep 29

VettaFi Voices On: Managing Risk in an Uncertain Economy

Sep 29

SPYI Outperforms SPY in Challenging 3rd Quarter

Sep 29

More Rate Hikes? Watch Treasury ETF USFR

QQQ

Invesco QQQ Trust Series I

SPY

SPDR S&P 500 ETF Trust

VOO

Vanguard S&P 500 ETF

TLT

iShares 20+ Year Treasury...

JEPI

JPMorgan Equity Premium...

TSLY

YieldMax TSLA Option Income...

SMH

VanEck Semiconductor ETF

VGT

Vanguard Information...

SCHD

Schwab US Dividend Equity ETF...

VTI

Vanguard Total Stock Market...


Content continues below advertisement

Loading Articles...
Our Sites
  • VettaFi
  • Advisor Perspectives
  • ETF Trends
Tools
  • ETF Screener
  • Mutual Fund to ETF Converter
  • Head-To-Head ETF Comparison
  • ETF Country Exposure Tool
  • ETF Stock Exposure Tool
  • ETF Database Pro
More Tools
  • Financial Advisor & RIA Center
Explore ETFs
  • ETF News
  • ETF Category Reports
  • Premium Articles
  • Alphabetical Listing of ETFs
  • Browse ETFs by ETF Database Category
  • Browse ETFs by Index
  • Browse ETFs by Issuer
  • Compare ETFs
Information
  • Contact Us
  • Terms of Use and Privacy Policy
  • © 2023 VettaFi LLC. All rights reserved.

Advertisement

Is Your Portfolio Positioned With Enough Global Exposure?

ETF Education Channel

How to Allocate Commodities in Portfolios

Tom LydonApr 26, 2022
2022-04-26

A long-running debate in asset allocation circles is how much of a portfolio an investor should...

Core Strategies Channel

Why ETFs Experience Limit Up/Down Protections

Karrie GordonMay 13, 2022
2022-05-13

In a digital age where information moves in milliseconds and millions of participants can transact...

}
X