
The streaming and gaming sector has been rising in popularity as widespread internet access and new technological innovation have changed the way people consume media. Over the past few years, streaming and gaming have become an even larger part of society as many people shifted from in-person interactions at restaurants and bars to online interactions like Netflix (NFLX, 2.8% index weight) watch parties and video games.(1) One common concern has been whether the reopening of the service economy would hurt these segments. According to data from the Bureau of Economic Analysis (BEA), consumers have returned to spending money on in-person interactions; however, consumer spending on video streaming, audio streaming, and internet access has also continued to increase and has illustrated that a shift to streaming technology has been a longer-term trend—one that started long before the COVID-19 pandemic and has persevered even through the reopening of the economy. This note discusses some of the sectors underlying the S-Network Streaming & Gaming Index in context of recent consumer spending data and long-term thematic trends.
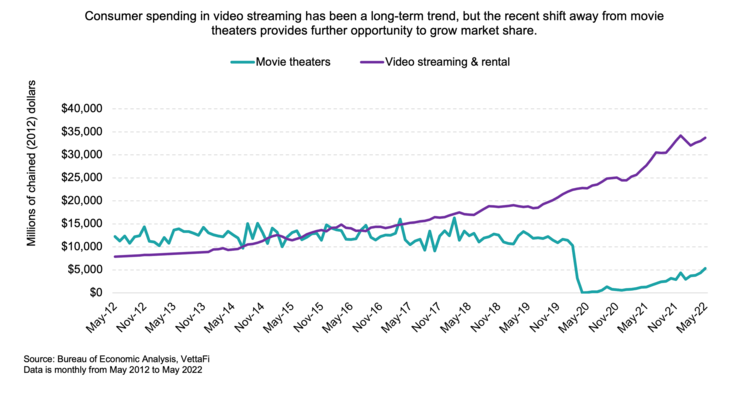
Video streaming strengthens as media consumption shifts to digital.
In May 2022, Americans spent 8.9% more money on alcohol purchased at restaurants and 7.3% more money on meals at restaurants compared to pre-pandemic levels—suggesting that many people have confidently returned to in-person socialization.(2) Despite Americans returning to restaurants and bars, consumer spending on video streaming has continued to strengthen. Because there was not an obvious pull-forward in video streaming during the pandemic, current demand could be viewed as more sustainable relative to areas like e-commerce, for instance, which could see normalization of growth rates after several months of acceleration. Instead, digital consumption habits for movies have been evolving steadily over the past few years along with better access to internet and more connected devices. In contrast, spending at movie theaters has been declining since before the pandemic (e.g., down 5.8% in 2019 from 2018). And currently, movie theaters have still not recovered from early 2020, when both attendance and sales dropped severely due to movie closures and a lack of new movie releases. Now business models have evolved, with theatrical windows for most major studios dropping from around 90 days to 45 days on average before movies are released on streaming and video-on-demand.(3) Shorter theatrical windows combined with a shifting preference to digital media may signify that recent sales lost from movie theaters may not be fully recovered and could provide video streaming with additional opportunity to grow its market share.
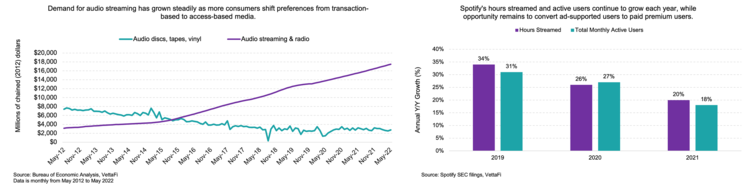
Higher demand for audio streaming has grown steadily over several years signaling a shift from transaction-based to access-based.
Audio streaming has also grown steadily over the past few years, and similarly to video streaming, there actually has been little impact from the pandemic. Growth in audio streaming has long been supported by increased internet access, higher speeds, and cloud storage, which has transitioned the industry from physical media sales to streaming models. Spotify Technology (SPOT, 2.8% index weight), which is the largest audio streaming subscription service in the world, cites an inflection point in 2015 when streaming models helped the global recorded music industry (including both streaming and physical media) finally exhibit growth after over 10 years of declines.(4) Using SPOT as an example, the company has seen double-digit year-over-year growth in both its active user base and its total hours streamed over the past few years given changing preferences away from transaction-based purchases toward access-based, on-demand streaming models. Streaming services can be more growth-oriented compared to physical media since they often emphasize discovery of new music through tailored playlists and radio stations, which offer the user a wider range of music options while simultaneously increasing the service’s streaming hours. Despite rapid growth in its user-base, SPOT still has potential for sales growth since currently only 43% of its users are premium subscribers compared to those who use free, ad-supported accounts.(5)
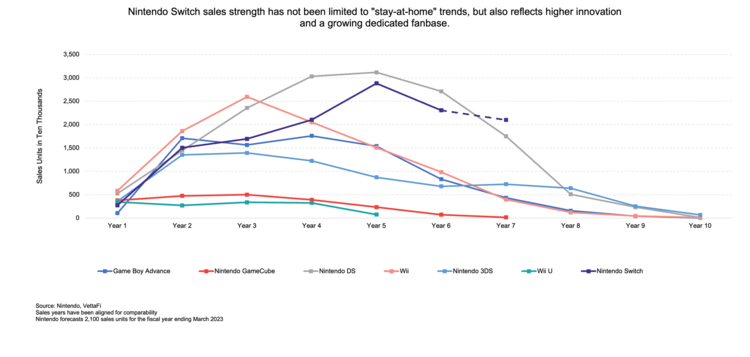
Increased demand for video games reflects better innovation and a growing dedicated fanbase.
BEA data does not provide clear consumer spending figures for gaming, but data from individual companies like Sony (6758 JP, 4.9% index weight) and Nintendo (7974 JP, 4.8% index weight) suggest that demand remains strong especially with the release of several new consoles over the past few years (e.g., Nintendo Switch in 2017 and Playstation 5 in 2020). Sales of Nintendo Switch units, for example, increased 37.1% in the fiscal year ending March 31, 2021, when popular games like Animal Crossing: New Horizons (now the second highest selling Switch game on record) were released during the peak of pandemic lockdowns.(6) But Switch unit sales dropped 20.0% in the most recent fiscal year ending March 31, 2022 and the company forecasts unit sales to drop another 8.9% next year. While this could suggest a normalization from a pandemic pull-forward, unit sales are still stronger on a comparable year basis relative to other Nintendo platforms. And unlike past platforms, the Nintendo Switch continues to release more software titles and add-ons years after the platform’s initial debut.(7) This can be attributed to better innovation and technology in gaming than previous years but is also a result of a more dedicated user fanbase driven by a desire for online, interactive play (e.g., the highest selling Switch game, Mario Kart 8 Deluxe) and the rise of video game streaming like Twitch which didn’t hit mainstream popularity until around 2014 when it was acquired by Amazon (AMZN).
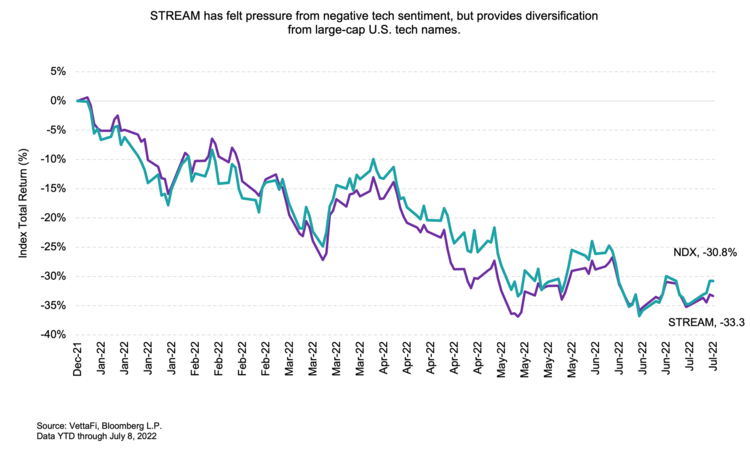
Bottom Line:
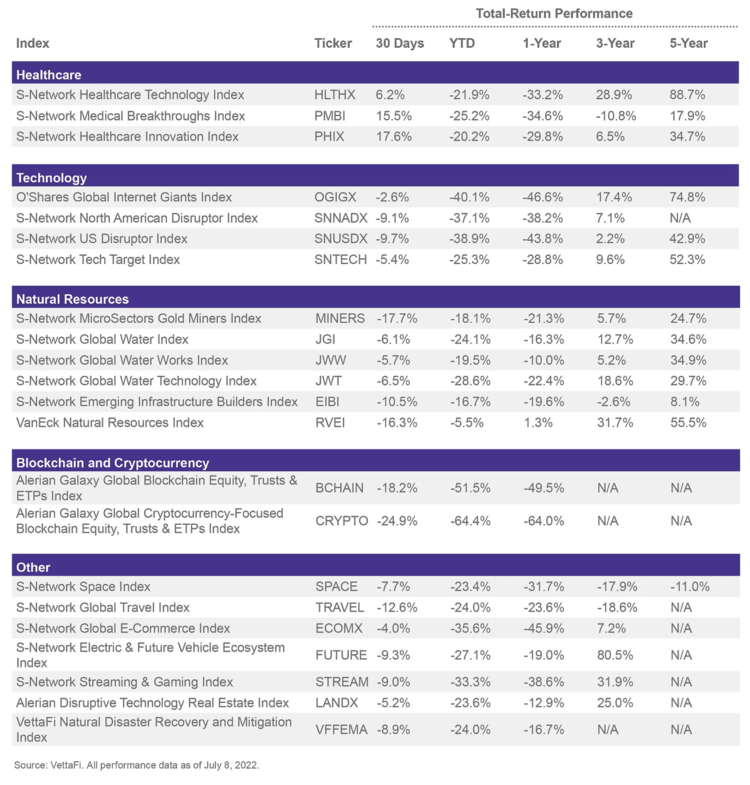
Although many people have returned to in-person socialization, streaming and gaming demand continues to strengthen. These trends have existed for several years alongside the growth of internet, connected devices, and social media, and the lack of a significant pull-forward during the pandemic suggests that streaming and gaming are growing at relatively sustainable levels. The sector, however, has felt pressure from negative tech sentiment with total return similar to the tech-heavy Nasdaq-100 Index (NDX). While STREAM is closely correlated to the NDX, the index provides some diversification away from U.S. larger-cap tech names, currently sharing only 7 of its 45 constituents (less than 1/3 of its index weight). For example, Asian based Nintendo, Sony, and Tencent (700 HK, 5.2% index weight) are all constituents in STREAM along with Roblox (RBLX, 4.2% index weight), Walt Disney (DIS, 4.1% index weight), and Roku (ROKU, 3.7% index weight) which are not currently found in NDX.
The S-Network Streaming & Gaming Index (STREAM) is the underlying index for the First Trust S-Network Streaming & Gaming ETF (BNGE ).
Related Research:
Streaming and Gaming: Playing the Digital Transformation
Legacy Automakers Charge Ahead of New Entrants in EV Push
Prepare for the Unfortunate but Inevitable Natural Disaster
Thematic Times: Secular Shift to Online Shopping Continues
Crypto Logs: Bitcoin ETFs vs. Index-Based Crypto ETFs
(1) All index weights are as of July 8, 2022.
(2) Bureau of Economic Analysis: Table 2.4.6U
(3) AMC Entertainment 4Q21 Earnings Release
(4) Spotify (SPOT) 2021 Annual Report
(5) Spotify (SPOT) 1Q22 Shareholder Letter
(6) Nintendo Top Selling Video Game Sales Units and Title Sales Units

