
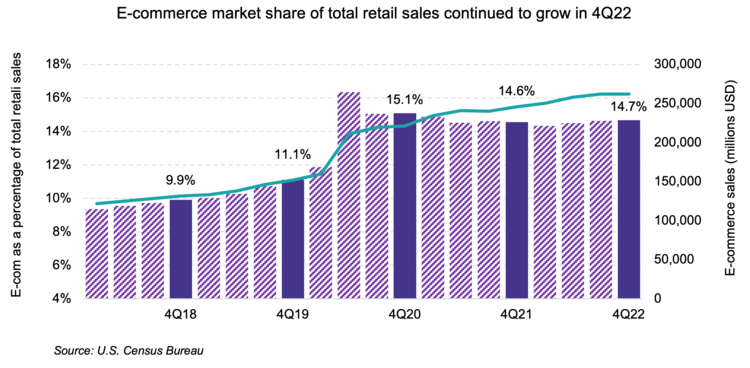
According to the latest U.S. e-commerce data release on February 17, 4Q e-commerce continues to grow its market share of total retail sales on a year-over-year basis as predicted. The S-Network Global E-Commerce Index (ECOMX) was up 12.9% YTD on a total return basis compared to the S&P 500 Index (SPX) which was up only 6.5% (as of February 17, 2023). While we often discuss U.S. e-commerce data in relation to e-commerce indexes and ETFs, it is important to recognize that this figure only accounts for a specific portion of e-commerce sales. From the U.S. Census Bureau data’s perspective, e-commerce sales typically refer to the sale of goods. When this figure is compared to total retail sales, that also refers to total retail sales from “companies…that sell merchandise and related services to final consumers” which excludes restaurants and also many service-related sectors.
But in reality, the e-commerce space is a team of the good, the bad, and the ugly except with goods, mobile apps (which aren’t bad but sort of rhyme), and the hugely ignored service sector. So while the U.S. Census Bureau data is important for overall trends, many constituents within the ECOMX index earn revenue through other means outside of physical goods. This note examines the top five constituents of ECOMX and how they actually earn revenue.1
Airbnb (ABNB, 2.2% index weight) — Airbnb earns revenue through its two-sided marketplace. A host offers a space for rent through Airbnb’s online platform and guests rent out the space. Airbnb earns a 3% commission from the host and also takes a 15-20% service fee from the guest. This business model is adaptable to various market conditions because hosts and guests control their own supply and demand including where rentals are available globally, prices, and types of rentals in demand (e.g., private house, private rooms, shared spaces). Revenues do not depend on stereotypical e-commerce trends like buying and selling goods. Travel demand is the main driver of the business, which is affected by competition from traditional hotels and lodging along with other internet-based marketplaces like Booking, Expedia, and TripAdvisor.
Meta Platforms (META, 2.1% index weight) — Meta currently earns the majority of its revenue from selling advertising spots on its family of apps (Facebook, Instagram, Messenger, and WhatsApp) to marketers. This means that instead of directly selling its own products online, Meta facilitates the selling of products and services from other retailers through these advertisements. Company revenues depend not only on marketer budgets and overall demand for their products and services, but also active users and user engagement on Meta’s apps. In addition to e-commerce and retail trends, company revenues are highly dependent on internet usage and social media trends.
Uber Technologies (UBER, 2.0% index weight) — Uber earns the majority of its revenues from riders in its mobility segment (i.e., Uber’s rideshare business) and subscription fees for its monthly “Uber One” pass, while payments to drivers are recognized in cost of revenue. In 2022, mobility contributed 44.0% to the company’s total revenue, followed by delivery revenue (34.2%), and freight revenue (21.8%). In the mobility segment, revenues may depend on factors like cost of public transportation, competition from other rideshare apps, vehicle ownership, ability of consumers to spend on entertainment (e.g., going to bars or downtown to high traffic/expensive parking areas), and overall app usage.
DoorDash (DASH, 1.9% index weight) — DoorDash operates similarly to Uber’s food delivery segment. DoorDash earns the majority of its revenue from its Marketplace segment which includes commissions from partner merchants (i.e., restaurants) and fees charged to consumers (i.e., app users, those ordering food). Like Uber, drivers are paid for their services through cost of revenue. The Marketplace segment also earns revenues from membership fees for its “DashPass” subscription. Company revenues are driven by ability of consumers to spend on leisure services including restaurant food and delivery fees. Other important factors include food options and pricing from partner merchants and competition from other delivery apps which may have lower delivery fees.
Shopify (SHOP, 1.9% index weight) — Out of the five constituents discussed in this report, Shopify is more of a traditional e-commerce company. In 2022, 73.4% if its total revenue was derived from merchant solutions including payment processing fees, currency conversion fees, transaction fees, and advertising revenue. The remaining portion of its revenue was mostly earned through its subscription plans which offer merchants tools and support to grow their platforms (examples of clients range from goods to food to services including Mattel, Heinz, and Netflix). While the subscription portion of its business provides monthly recurring revenue, the majority of its revenue is correlated with the total dollar value of orders facilitated through Shopify’s platform. This correlates with online purchases of goods in addition to online purchases of services and overall internet usage trends.
Bottom Line:
E-commerce deals with selling goods and services online, and companies that operate within that space can vary from online marketplaces, traditional retailers with large online storefronts, content navigation, and delivery companies. While U.S. e-commerce data will continue to be a large part of the e-commerce story, constituent performance is also driven by other factors including consumer ability and willingness to spend on food, services, and leisure along with trends in internet adoption, mobile device/app penetration, and social media usage.
The S-Network Global E-Commerce Index (ECOMX) is the underlying index for the First Trust S-Network E-Commerce ETF (ISHP).
For more news, information, and analysis, visit VettaFi | ETFDB.

