
Last week’s economic landscape was defined by conflicting signals from key indicators, suggesting a growing divergence between investor behavior and underlying consumer health. Margin debt surged to a new high while consumer confidence simultaneously fell to near-historic lows. Adding to the mixed picture, the delayed jobs report delivered a cautious read on the labor market, showing an increase in hiring offset by a rise in the unemployment rate. Meanwhile, against this backdrop, the S&P 500 endured a volatile week with sharp daily swings that eventually stabilized thanks to encouraging guidance on future interest rate policy.
Employment Report
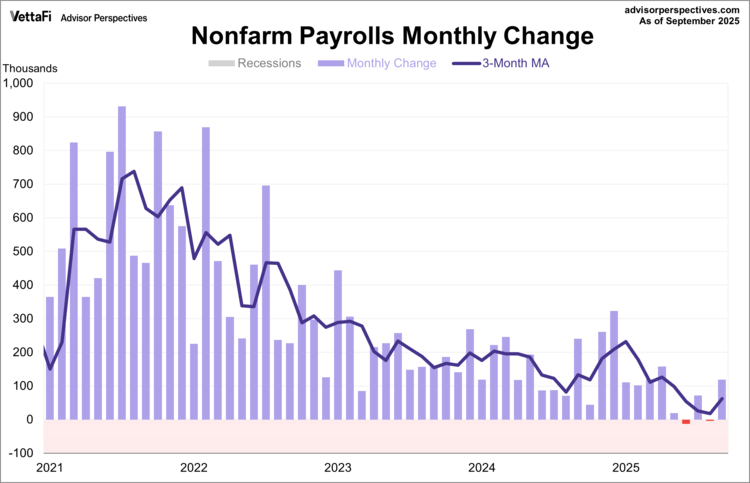
The long-awaited jobs report the BLS showed an uptick in hiring for September. Nonfarm Payrolls added 119,000 jobs, marking the largest job growth since April and more than doubling the expected 53,000 addition. This jump followed a revised loss of 4,000 jobs in August.
However, despite the relatively strong hiring figures, the report still showed signs of a cooling labor market. The revised August payrolls turned negative, showing a loss of 4,000 jobs, and unemployment continued to rise. The unemployment rate reached 4.4%, its highest level in nearly four years and above the expected 4.3% reading.
It’s important to note that this backward-looking data does not reflect the current state of the labor market, as the report was delayed due to the government shutdown. Furthermore, the scheduled October jobs report will not be published, with some of its data incorporated into the upcoming November release.
Michigan Consumer Sentiment
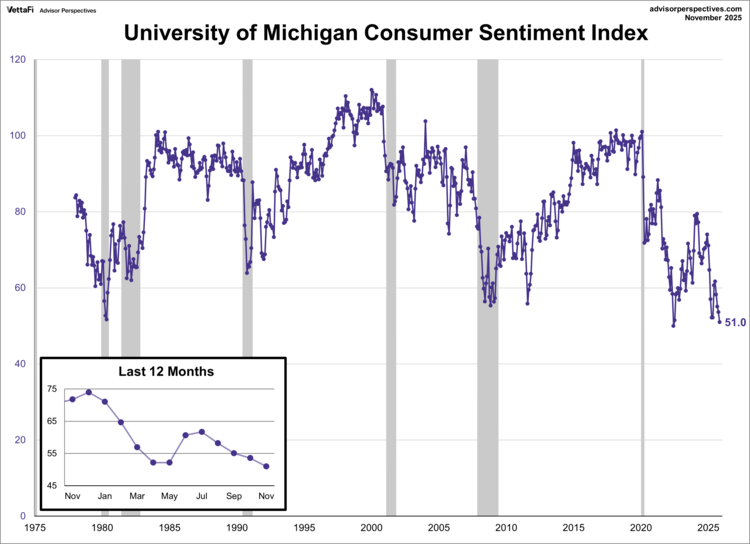
The University of Michigan Consumer Sentiment Index nearly 5% from October to 51.0 this month, remaining at its lowest level since 2022 and securing the second-lowest sentiment reading of all-time. While the final figure was revised slightly higher following the end of the government shutdown and exceeded the forecast of 50.3, the reading still reflects a nearly 30% decline compared to one year ago.
The index’s deterioration can largely be attributed to significant declines in consumers’ perceptions of their current personal finances and buying conditions, though this was partially offset by improved future expectations. Notably, even consumers with the largest stock holdings, who previously reported increased sentiment, have grown pessimistic over the market’s performance the past two weeks.
On the inflation front, near-term expectations cooled for a third consecutive month, dropping from 4.6% in October to 4.5% in November. Additionally, long-term expectations cooled significantly, falling from 3.9% to 3.4% for the five year outlook.
The Consumer Discretionary Select Sector SPDR ETF (XLY ) is tied to consumer sentiment.
Margin Debt
Margin debt to a new high of $1.18 trillion in October, marking the sixth consecutive monthly increase and its fifth straight record. More significantly, when adjusted for inflation, the real debt level is also at its highest level in history, sitting just above the prior 2021 peak. This historic climb represents a 40.7% surge over the past year and a 4.8% increase month-over-month.
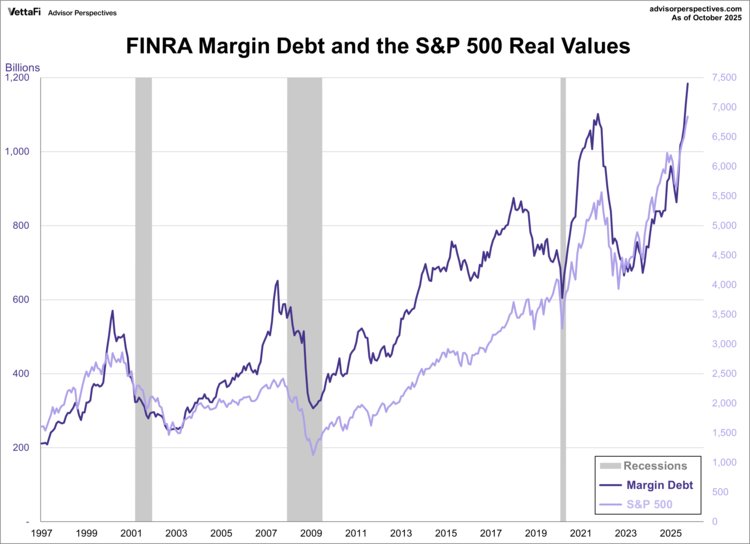
Margin Debt is a key indicator of investor sentiment and risk appetite. There is a near-parallel relationship between debt levels and market, as significant increases in borrowing, often correlate with market peaks, while troughs in debt tend to precede market bottoms.
While high levels of margin debt can signal strong investor confidence, it also means a higher risk appetite which can increase market volatility. The sheer scale of borrowing over the past several months suggests unparalleled levels of risk-taking in the current stock market environment, potentially setting the stage for a magnified sell-off should a market decline trigger margin calls.
Market Reactions
The S&P 500 a volatile week, falling below its 50-day moving average for the first time since April. The index ultimately posted a weekly loss of 2.0%. As a result, the SPDR S&P 500 ETF Trust (SPY ) fell 1.9% last week. Meanwhile, the S&P Equal Weight Index was 0.9% from the previous week and the Invesco S&P 500® Equal Weight ETF (RSP ) fell 0.8%.
The 10-year Treasury yield the week at 4.06%, while the 2-year note finished at 3.51%.
The CME FedWatch Tool currently shows a 72% likelihood that the Fed will cut rates by 25 basis points at their next meeting. Markets are also pricing in three additional 25 basis point cuts in 2026.
Economic Data in the Week Ahead
The upcoming week will feature a handful of major economic data on a compressed timeline, due to the holiday shortened week and the effort to clear the backlog from the recent government shutdown. The primary focus will be on the release of key September data, including reports on inflation, consumer spending, and business investment. These rescheduled reports will include the PCE Price Index, the Producer Price Index, Retail Sales, and Durable Goods.
Beyond the catch-up reports, the week still holds its regularly scheduled releases, including the preliminary reading of Q4 Gross Domestic Product (GDP). Data on consumer health will be provided by the Conference Board Consumer Confidence Index, and the housing sector will be analyzed with releases including the S&P Case-Shiller Home Price Index, Pending Home Sales, and New Home Sales. Rounding out the data will be regional manufacturing and activity reports, notably the Richmond Fed, the Chicago PMI, and the Chicago Fed National Activity Index.
Originally published by Advisor Perspectives
For more news, information, and strategy, visit ETFdb.

