
ETFdb Logo
  • ETF Database
  • Content Hubs
    • Themes
      • Active ETF
      • Alternatives
      • Artificial Intelligence
      • China Insights
      • Core Strategies
      • Crypto
      • Disruptive Technology
      • Energy Infrastructure
      • ETF Building Blocks
      • ETF Investing
      • ETF Strategist
      • Financial Literacy
      • Fixed Income
      • Free Cash Flow
      • Future ETFs
      • Innovative ETFs
      • Institutional Income Strategies
      • Leveraged & Inverse
      • Market Insights
      • Market Outlooks
      • Modern Alpha
      • Nuclear Energy
      • Portfolio Strategies
      • Sector Investing
      • Tax Efficient Income
      • Thematic Investing
    • Asset Class
      • Equity
        • U.S. Equity
        • Int'l Developed
        • Emerging Market Equities
      • Alternatives
        • Gold/Silver/Critical Materials
        • Cryptocurrency
        • Currency
        • Volatility
      • Fixed Income
        • Investment Grade Corporates
        • US Treasuries & TIPS
        • High Yield Corporates
        • Int'l Fixed Income
    • ETF Ecosystem
    • ETFs in Canada
    • Crypto ETF Hub
  • Tools
    • ETF Screener
    • ETF Country Exposure Tool
    • ETF Database Categories
    • Indexes
    • Scenario Analysis
    • Watchlists
    • Head-To-Head ETF Comparison Tool
    • Mutual Fund To ETF Converter
    • ETF Stock Exposure Tool
    • ETF Issuer Fund Flows
  • Research
    • ETF Education
    • Equity Investing
    • Dividend ETFs
    • Leveraged ETFs
    • Inverse ETFs
    • Index Education
    • Index Insights
    • Top ETF Sectors
    • Top ETF Issuers
    • Top ETF Industries
  • Webcasts
  • Sectors
    • Sector Investing Content Hub
    • XLK
    • XLI
    • XLU
    • XLY
    • XLP
    • XLRE
    • Sector Power Rankings
    • XLE
    • XLC
    • XLF
    • XLV
    • XLB
  • Multimedia
    • ETF 360 Video Series
    • ETF of the Week Podcast
    • Gaining Perspective Podcast
    • ETF Prime Podcast
    • Video
  • Company
    • About VettaFi
  • PRO
    • Pro Content
    • Pro Tools
    • Advanced
    • FAQ
    • Free sign up
    • Login
  1. New Home Sales Rise as Median Price Hits Near 5-Year Low
News
Share

New Home Sales Rise as Median Price Hits Near 5-Year Low

Jennifer NashMay 05, 2026
2026-05-05

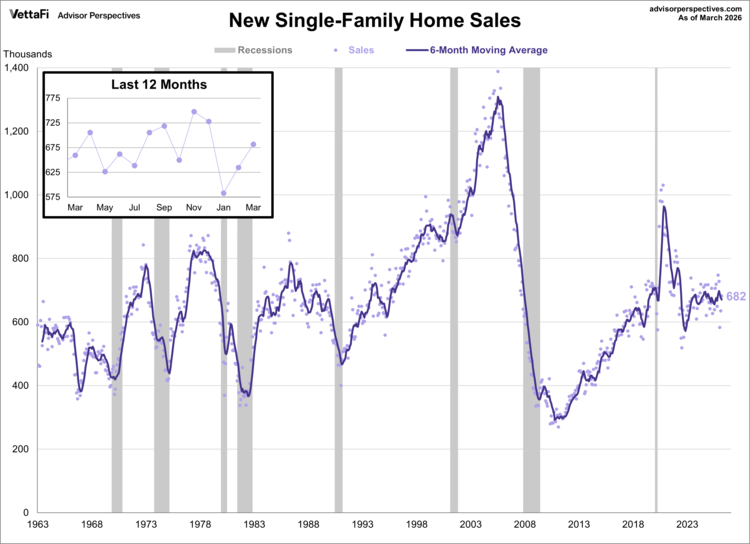
According to the Census Bureau, new home sales were at a seasonally adjusted annual rate of 682,000 in March. This represents a 7.4% increase from February’s rate of 635,000 and a 3.3% rise from the previous year. The latest reading was higher than the forecast of 652,000.

For a long-term perspective, here is a snapshot of the series beginning in 1963. We’ve included a six-month moving average to highlight the trend in this highly volatile series.
New Home Sales Rise as Median Price Hits Near 5-Year Low

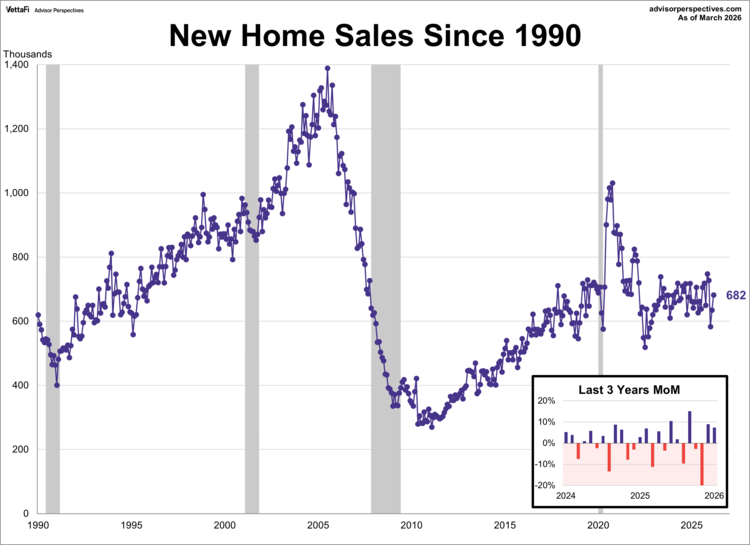
For a closer look, the next chart shows new home sales since 1990. Over this time frame, we see the steady rise in new home sales following the early-90s recession and the acceleration in sales during the real estate bubble that peaked in 2005. Starting in 2011, there was a similar rise in new home sales that peaked near the end of 2020 and retracted for about two years. New home sales showed consistent growth at the start of 2023 but have been stagnant over the past couple of years.

Content continues below advertisement

New Home Sales Rise as Median Price Hits Near 5-Year Low

New Home Sales: The Population-Adjusted Reality

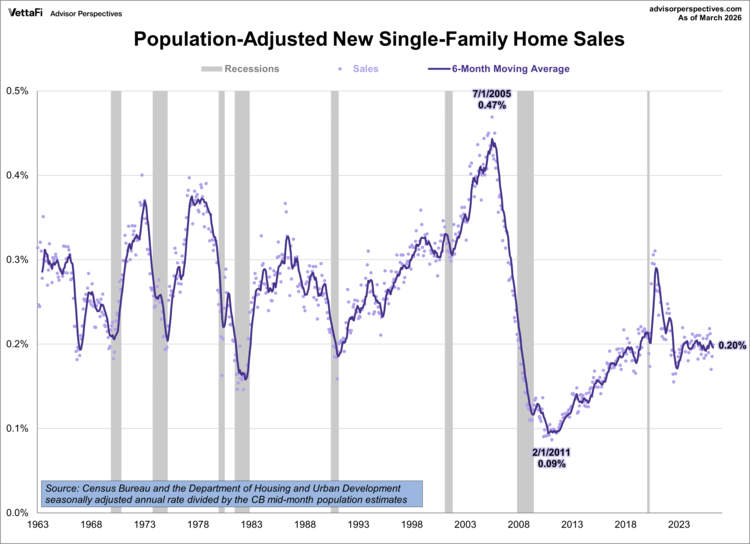
Simply looking at raw new home sales figures can be misleading, as a growing population naturally suggests a higher number of sales. To gain a clearer picture of housing market strength relative to population growth, we need to normalize the data with a simple population adjustment. This adjustment—expressing new home sales as a percentage of the population—allows us to see the proportion of the population actively purchasing new homes, effectively accounting for the increase in potential buyers. This reveals whether housing demand is truly keeping pace with population growth.

The Census Bureau’s mid-month population estimates show a 82.1% increase in the U.S. population since 1963. Here is a chart of new home sales as a percentage of the population.
New Home Sales Rise as Median Price Hits Near 5-Year Low

This adjusted data reveals key trends. A rising percentage indicates a healthy market with increased demand relative to population, while a declining percentage suggests a weakening market and reduced demand. New home sales as a percentage of the population peaked at 0.47% in July 2005, showing strong demand, and bottomed at 0.09% in February 2011, reflecting a severe downturn.

New single-family home sales are 15.4% above the 1963 start of this data series. However, the population-adjusted version is 36.6% below the first 1963 sales.

The 30-Year Fixed Rate Mortgage

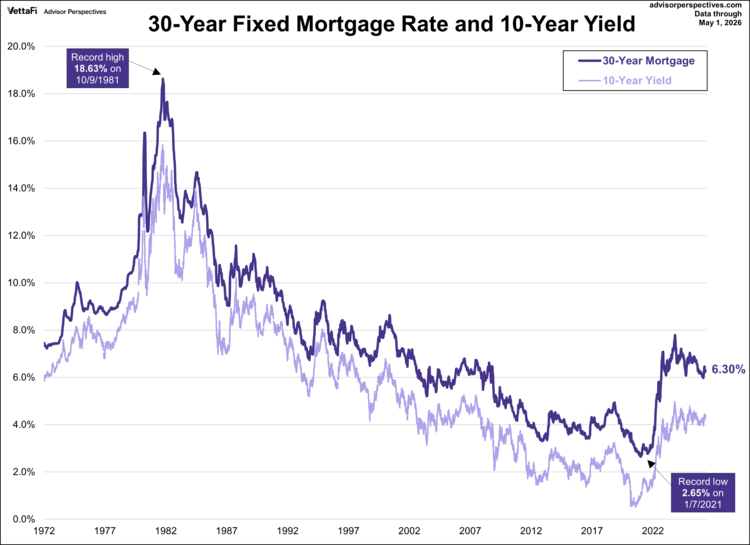
According to Freddie Mac, the average 30-year fixed rate mortgage in March 2026 was 6.18%. While lower than recent peaks, the rate remains high enough to sustain the “lock-in effect,” where homeowners are reluctant to trade in their current low-interest mortgages for new, higher-rate loans, further suppressing available inventory.
New Home Sales Rise as Median Price Hits Near 5-Year Low

New Home Sales: Median Price

The median price for a new home dropped to its lowest level in nearly five years, coming in at $387,400. This represents a 5.3% decrease from the previous month and a 6.2% decline from one year ago. However, after adjusting for inflation, the real price is at its lowest level since 2014 with a monthly change of -6.3% and an annual change of -9.1%.

This next chart shows the inflation-adjusted median sales price of new homes since 1963, using the consumer price index for all urban consumers (CPI-U) for the inflation adjustment. We’ve included a six-month moving average to give us a clearer sense of the trend.
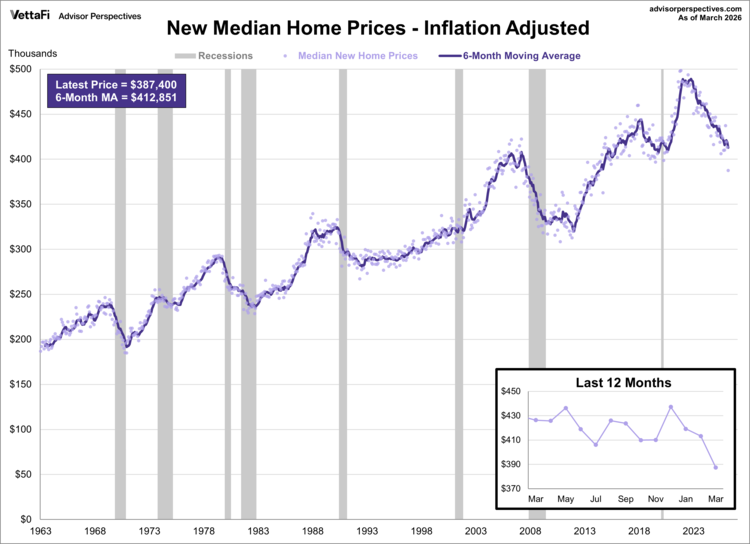
New median price for a new home

ETFs associated with residential real-estate include: iShares Residential and Multisector Real Estate ETF (REZ B+).

ETFs associated with home builders include: Invesco Dynamic Building & Construction ETF (PKB A), iShares U.S. Home Construction ETF (ITB A) and SPDR S&P Homebuilders ETF (XHB A+).

For additional perspectives on residential real estate, here is the complete list of our monthly updates:

  • S&P/Case-Shiller Home Price Index
  • FHFA House Price Index
  • NAHB Housing Market Index
  • Existing Home Sales
  • New Residential Housing Starts
  • New Residential Building Permits
  • Pending Home Sales

Originally published on Advisor Perspectives

For more news, information, and strategy, visit ETFdb.

» Popular Pages

  • Tickers
  • Articles

Jul 16

Rising Consumer Spending Builds Investment Case For IBUY ETF

Jul 16

Beyond Gold: Why Broad Commodities ETFs Win

Jul 16

Dividends vs. Distributions: What Investors Need to Know

Jul 16

T. Rowe Price Launches First Active Multi-Token Spot Crypto ETP TKNZ

Jul 16

Retail Sales Rise for Fifth Straight Month

Jul 16

Notes from the Desk: Priced for Perfection

Jul 16

Beyond Data Centers, Nuclear’s Investment Thesis Is Solid

Jul 16

The Loser's Game

Jul 16

Dividends Carry the Day With This Small-Cap ETF

Jul 16

VettaFi’s Murphy Discusses AI Value Chain on Yahoo! Finance

QQQ

Invesco QQQ Trust Series I

VOO

Vanguard S&P 500 ETF

GLD

SPDR Gold Shares

SCHD

Schwab US Dividend Equity ETF...

SMH

VanEck Semiconductor ETF

DRAM

Roundhill Memory ETF

SIVR

abrdn Physical Silver Shares...

PPLT

abrdn Physical Platinum...

VGT

Vanguard Information...

SOXX

iShares Semiconductor ETF


Content continues below advertisement

Loading Articles...

Advertisement

Is Your Portfolio Positioned With Enough Global Exposure?

ETF Education Channel

How to Allocate Commodities in Portfolios

Tom LydonApr 26, 2022
2022-04-26

A long-running debate in asset allocation circles is how much of a portfolio an investor should...

Core Strategies Channel

Why ETFs Experience Limit Up/Down Protections

Karrie GordonMay 13, 2022
2022-05-13

In a digital age where information moves in milliseconds and millions of participants can transact...

}
X
