ETFdb Logo
  • ETF Database
  • Channels
    • Themes
      • Active ETF
      • Alternatives Channel
      • Artificial Intelligence
      • China Insights
      • Climate Insights
      • Core Strategies
      • Crypto
      • Disruptive Technology
      • Energy Infrastructure
      • ETF Building Blocks
      • ETF Education
      • ETF Investing
      • ETF Strategist
      • Faith-Based Investing
      • Financial Literacy
      • Fixed Income
      • Free Cash Flow
      • Innovative ETFs
      • Invest Beyond Cash
      • Leveraged & Inverse
      • Modern Alpha
      • Portfolio Strategies
      • Tax Efficient Income
    • Asset Class
      • Equity
        • U.S. Equity
        • Int'l Developed
        • Emerging Market Equities
      • Alternatives
        • Gold/Silver/Critical Materials
        • Crypytocurrency
        • Currency
        • Volatility
      • Fixed Income
        • Investment Grade Corporates
        • US Treasuries & TIPS
        • High Yield Corporates
        • Int'l Fixed Income
    • ETF Ecosystem
    • ETFs in Canada
    • Market Outlook
    • Crypto ETF Hub
  • Tools
    • ETF Screener
    • ETF Country Exposure Tool
    • ETF Database Categories
    • Indexes
    • Scenario Analysis
    • Watchlists
    • Head-To-Head ETF Comparison Tool
    • Mutual Fund To ETF Converter
    • ETF Stock Exposure Tool
    • ETF Issuer Fund Flows
  • Research
    • ETF Education
    • Equity Investing
    • Dividend ETFs
    • Leveraged ETFs
    • Inverse ETFs
    • Index Education
    • Index Insights
    • Top ETF Sectors
    • Top ETF Issuers
    • Top ETF Industries
  • Webcasts
  • Themes
    • AI ETFs
    • Blockchain ETFs
    • See all Thematic Investing ETF themes
    • ESG Investing
    • Marijuana ETFs
  • Multimedia
    • ETF 360 Video Series
    • ETF of the Week Podcast
    • Gaining Perspective Podcast
    • ETF Prime Podcast
    • Video
  • Company
    • About VettaFi
    • Get VettaFi’ed
  • PRO
    • Pro Content
    • Pro Tools
    • Advanced
    • FAQ
    • Pricing
    • Free Sign Up
    • Login
  1. Portfolio Management
  2. How to Measure Risk-Adjusted Returns
Portfolio Management
Share

How to Measure Risk-Adjusted Returns

Justin KuepperDec 18, 2015
2015-12-18

Many investors look for above-market returns when analyzing exchange-traded funds (ETFs) or other types of investments. But the amount of risk being assumed is perhaps even more important than these gross returns. After all, a risky micro-cap security that returns 50% in a given year may be valued differently when considering the extreme risks involved.

Risk-adjusted returns attempt to account for these risks and provide investors with a clearer picture.

In this article, we’ll take a look at some common ways to measures risk-adjusted returns and how individual investors can leverage them to improve their performance.

Sharpe Ratio

Sharpe Ratio Formula

Content continues below advertisement

The most commonly used measure of risk-adjusted return is the Sharpe Ratio, which represents the average return in excess of the risk-free rate per unit of risk (volatility or total risk). In effect, the calculation measures standard deviations of returns as a proxy for total portfolio risk and weights returns based on those deviations. The measure may be less accurate in cases where returns aren’t normally distributions and should be taken with a grain of salt.

Treynor Ratio

Treynor Ratio Formula

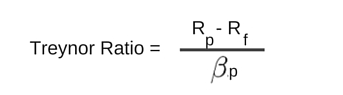
The Treynor Ratio, also known as the reward-volatility ratio, measures the same thing as the Sharpe Ratio, but uses a beta coefficient in place of standard deviations. By using the beta coefficient, the ratio compares the portfolio with the overall market rather than the rate of return for a risk-free investment. These dynamics can be useful for determining if a portfolio is outperforming the market’s average gains on a risk-adjusted basis.

Jensen’s Alpha

Jensen's Alpha Formula

Jensen’s Alpha leverages the Capital Asset Pricing Model (CAPM) to determine how much alpha, or excess returns, a portfolio is generating relative to the market, given both its average market return and beta coefficient. In general, a positive Jensen’s Alpha signals that a fund manager is beating the market. The statistic is commonly used in empirical finance to determine the marginal returns for a given exposure to an investment strategy.

Modigliani-Modigliani

Modigliani Squared Formula

The Modigliani-Modigliani Measure, better known as M2, measures portfolio returns that are adjusted for the risk of the portfolio relative to a benchmark. Essentially, in the calculation the portfolio assumes the same amount of risk as the market (as measured by standard deviation). As a result, the portfolio return is de-leveraged so that it can be compared to the benchmark or market return. Since it’s expressed in units of percentage return, the measure is often considered to be more useful than the Sharpe Ratio that inspired it, due to its intuitive interpretation. A portfolio with an M2 of 5% is clearly 1% superior to one with an M2 of 4%, while the real difference between Sharpe Ratio values of -0.5 and 0.5 may not be as obvious.

Information Ratio

Information Ratio Formula

The Information Ratio measures risk-adjusted returns by dividing the difference between a portfolio or security’s return and a benchmark return by the standard deviation of that active return. Often times, the ratio is used to assess fund managers relative to their benchmark indexes or the overall market as reflected by the S&P 500. The metric differs from the Sharpe Ratio in that it’s focused on “active” returns rather than “excess” returns.

The Bottom Line

There are many different ways to calculate risk-adjusted returns, ranging from the Sharpe Ratio to the M2 Measure, but the key takeaway for individual investors is that they shouldn’t be looking exclusively at returns without considering the risks. Often times, investors can find these ratios – especially the Sharpe Ratio – on various research websites or screeners in order to identify ETFs that are outperforming their peers on a risk-adjusted basis.

» Popular Pages

  • Tickers
  • Articles

Jul 14

This Bloomberg ETF Analyst Says Bitcoin ETFs Could Triple Gold in 5 Years

Jul 11

Main Management Market Note: July 11, 2025

Jul 11

Treasury Yields Snapshot: July 11, 2025

Jul 11

S&P 500 Snapshot: Index Retreats From Record High

Jul 11

Bitcoin's Real-World Utility: A Strategic Asset for U.S. Investors and Global Markets

Jul 11

Economic Crosscurrents in 2025: Inflation, Interest Rates, and Investment Strategy

Jul 11

June 2025’s Most Innovative ETF Launches

Jul 11

As Congress Mulls Muni Tax Repeal, Here's 8 ETFs to Ponder

Jul 11

Fidelity, T. Rowe Price, JPMAM Active International ETFs Outperform EFA

Jul 11

Market Update – July 11, 2025

QQQ

Invesco QQQ Trust Series I

VOO

Vanguard S&P 500 ETF

IBIT

iShares Bitcoin Trust ETF

SCHD

Schwab US Dividend Equity ETF...

SPY

SPDR S&P 500 ETF Trust

FIAT

YieldMax Short COIN Option...

IVV

iShares Core S&P 500 ETF

SMH

VanEck Semiconductor ETF

GLD

SPDR Gold Shares

AIQ

Global X Artificial...

Loading Articles...
Our Sites
  • VettaFi
  • Advisor Perspectives
  • ETF Trends
Tools
  • ETF Screener
  • Mutual Fund to ETF Converter
  • Head-To-Head ETF Comparison
  • ETF Country Exposure Tool
  • ETF Stock Exposure Tool
  • ETF Database Pro
More Tools
  • Financial Advisor & RIA Center
Explore ETFs
  • ETF News
  • ETF Category Reports
  • Premium Articles
  • Alphabetical Listing of ETFs
  • Browse ETFs by ETF Database Category
  • Browse ETFs by Index
  • Browse ETFs by Issuer
  • Compare ETFs
Information
  • Contact Us
  • Terms of Use and Privacy Policy
  • © 2025 VettaFi LLC. All rights reserved.

Advertisement

Is Your Portfolio Positioned With Enough Global Exposure?

ETF Education Channel

How to Allocate Commodities in Portfolios

Tom LydonApr 26, 2022
2022-04-26

A long-running debate in asset allocation circles is how much of a portfolio an investor should...

Core Strategies Channel

Why ETFs Experience Limit Up/Down Protections

Karrie GordonMay 13, 2022
2022-05-13

In a digital age where information moves in milliseconds and millions of participants can transact...

}
X