
Innovation remains a dominant and exciting theme in the ETF universe. Although, as with any financial instrument, with growth and evolution comes increasing complexity and newly discovered nuances.
While there’s certainly no one right way to go about looking for an ETF that fits your needs, it may be helpful to start by considering some of the noteworthy differences across similar products. ETF education is an ongoing process, and as such, there are a number of lessons to keep in mind. While some are fairly basic, many of the most important ones are oftentimes overlooked.
Below, we highlight five important distinctions to understand when investing in ETFs, complete with visual illustrations of actual performance histories (charts as of 4/22/2015).
1. Spot ≠ Futures
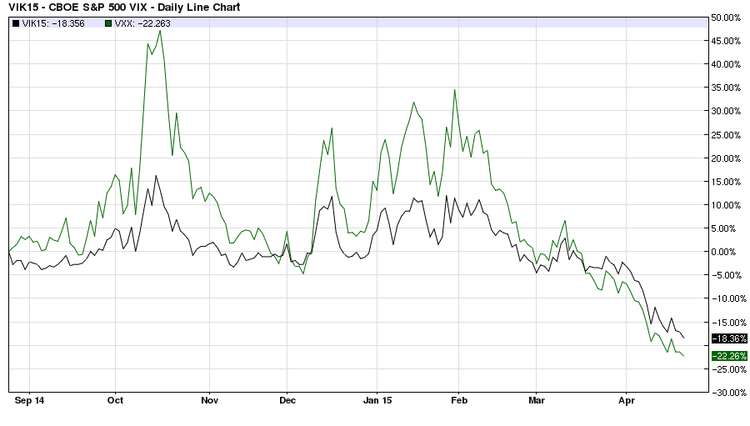
The Lesson: Some investors assume that ETPs utilizing futures contracts offer exposure to the underlying asset; for example, ETFs holding natural gas futures contracts will mimic movements in spot natural gas prices. That simply isn’t true. Futures-based strategies are often significantly impacted by the slope of the futures curve.
See also Spot vs. Futures.
The Proof: The following chart shows performance for the spot VIX, a popular measure of anticipated equity market volatility, compared to the S&P 500 VIX Short-Term Futures ETN (VXX ), an ETN that replicates the performance of an index comprising VIX futures.
2. Currency Impact Matters
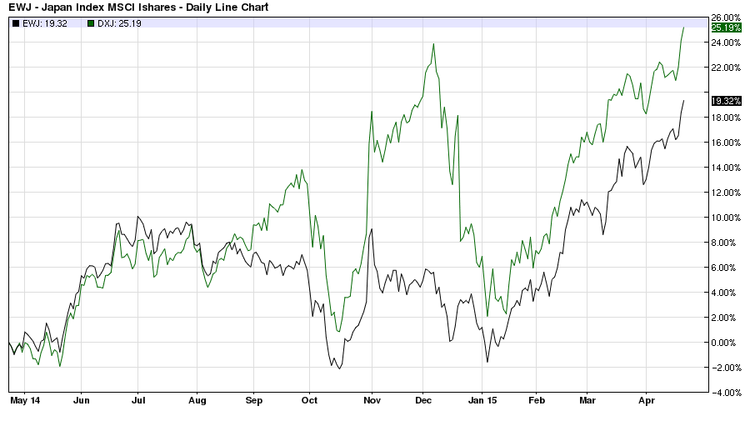
The Lesson: Investing in international stocks generally involves a bet on the underlying currency as well. Whether investors realize it or not, an investment in Japanese stocks effectively includes a long position in the yen and a short position in the U.S. dollar. Oftentimes, the impact of currency fluctuations on bottom-line returns realized by U.S. investors is significant.
See our King Dollar ETF Database Portfolio.
The Proof: The chart below shows the performance of two ETFs holding Japanese stocks. While the portfolios are substantially similar, there is one key difference: the WisdomTree Japan Hedged Equity Fund (DXJ ) strips out exposure to the Japanese yen, while the iShares MSCI Japan Index Fund (EWJ ) leaves that exchange rate risk in. When the yen is climbing, EWJ gets a boost. When the yen is sliding, however, DXJ will tend to outperform EWJ (as shown in the example below).
3. Small Cap Difference
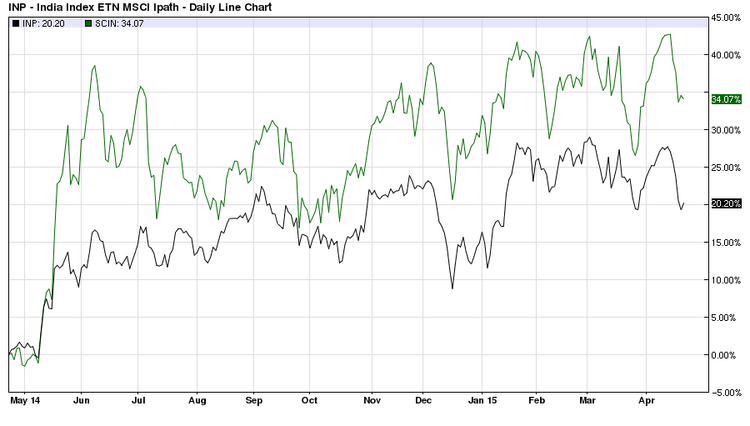
The Lesson: When using ETFs to achieve international equity exposure, investors now often have a choice between large-cap and small-cap stocks. While these two choices may seem very similar (targeting the same country), there can be significant differences in the risk and return profiles realized.
Be sure to see our Small Cap ETF Database Portfolio.
The Proof: The following table shows two India ETFs: EGShares India Small Cap ETF (SCIN ) holds small-cap stocks, while the MSCI India Index ETN (INP ) is linked to an index comprising larger companies. Small-cap stocks tend to exhibit more volatility on both the upside and downside. As show in the chart below, SCIN can at times deliver bigger returns, and losses, compared to its large-cap counterpart.
4. Expenses Matter
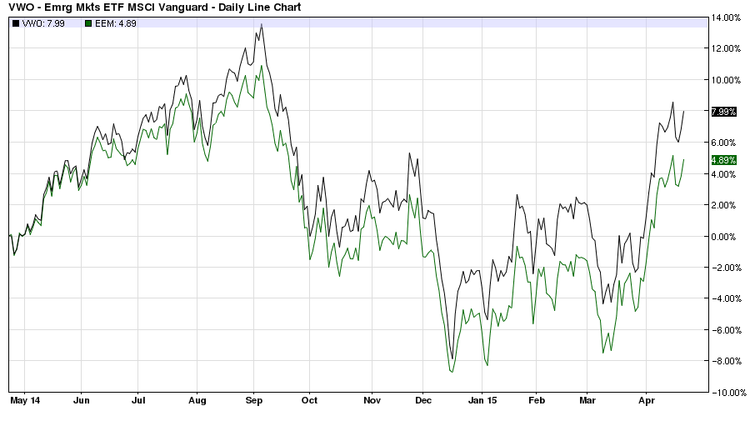
The Lesson: Even among ETFs that should be identical (those tracking seemingly identical indexes), differences in performance often arise. Expense ratios are one source of these deltas, while tracking error can also contribute to gaps in performance.
Try our Free ETF Head-To-Head Comparison Tool.
The Proof: The below chart compares Vanguard’s Emerging Markets ETF (VWO ) and iShares’ MSCI Emerging Markets ETF (EEM ), two ETFs that seek to provide broad-based exposure to emerging-markets equities. While their underlying portfolios do vary, differences in performance can also be attributed to their expense ratios; VWO charges 0.15% annually, while EEM costs 0.67%.
5. Style vs. Pure Style
The Lesson: Investors looking to target value or growth stocks will find different options available in the ETF universe. Some products cast relatively wide nets, while others are more targeted in nature, selecting only the individual securities that exhibit the strongest value or growth characteristics.
Be sure to see our Q&A – Why “Pure Style” ETFs Matter.
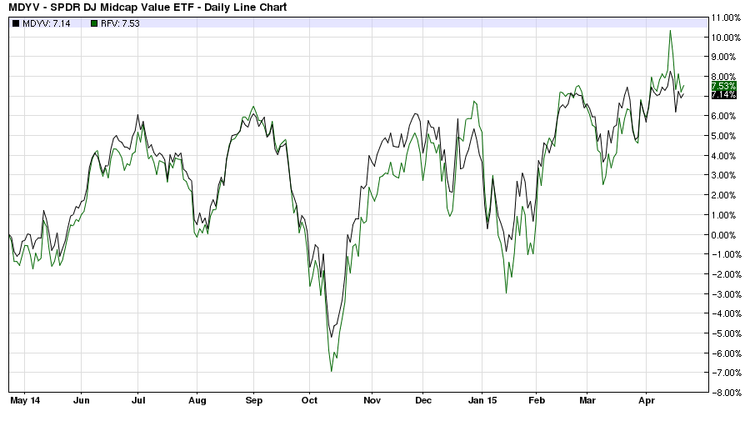
The Proof: The table below compares two ETFs that offer exposure to a very similar baskets of stocks: the State Street S&P 400 Mid Cap Value ETF (MDYV ) and the Guggenheim S&P MidCap 400 Pure Value ETF (RFV ). The historical performance is quite interesting; RFV, which holds a more targeted portfolio, has delivered much better returns in certain environments.
The Bottom Line
Pay attention to the details, including seemingly minor differences in indexes, expenses, and fund objectives, as they oftentimes lead to unexpected returns.
Follow me on Twitter @SBojinov
Disclosure: No positions at time of writing.

