
Over the last 20 years, Wall Street has witnessed both the rise and fall of hundreds of exchange traded products. For the most part, many of the funds that struggled during their first few years of trading were forced to close their doors. In this piece, however, we take a look at five ETFs that managed to make a comeback after several seemingly disastrous performances.
XIV Rebounds After Rough First Year
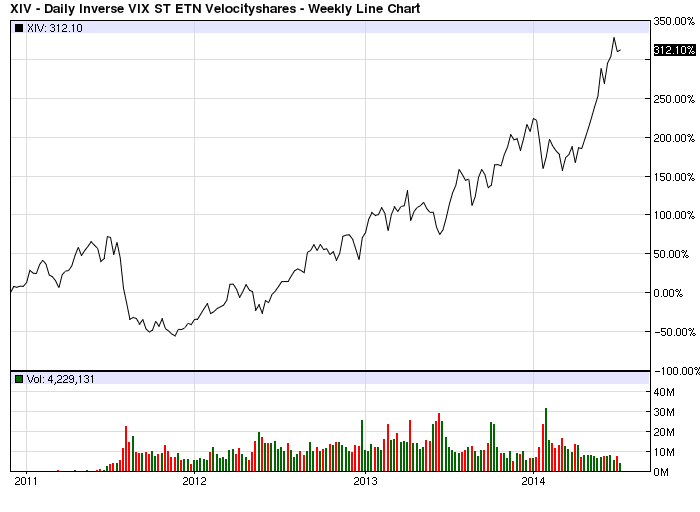
VelocityShares’ Daily Inverse VIX Short-Term ETN (XIV ) made its debut in November, 2010. The fund is designed to reflect the returns that are potentially available through an unleveraged investment in short-term futures contracts on the CBOE Volatility Index.
During the first seven months of trading, XIV managed to slowly, but surely, gain traction; it gained almost 100% during this period. But from its high in July of 2011, the fund lost half of its value by mid-August [see Five Important ETF Lessons].
Since bottoming out in late 2011, when XIV fell below the $5 mark, the fund jumped more than 800% in the following three years. In 2012 alone, the fund gained 154.88% on the year; and in 2013, XIV logged in a 107.2% gain.
SOCL Gains Popularity During Its Second Year
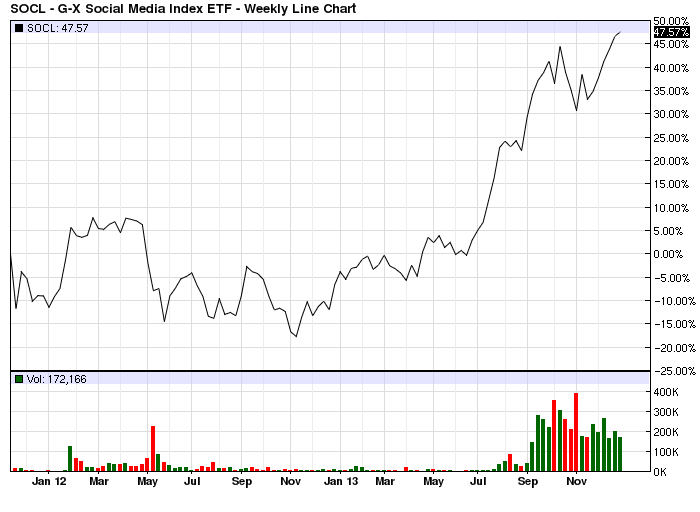
Global X’s debut of the Social Media Index ETF (SOCL ) was met with plenty of skepticism from Wall Street. Given the social media industry’s relatively short history, combined with a disastrous Facebook IPO, many were not ready to jump into such a hyper targeted fund.
From its launch in November of 2011, shares of SOCL never peaked above $16, and by mid-November of 2012, the fund was trading below $12. During the first quarter of 2013, SOCL traded within a narrow range, but by July, the fund really started to pick up steam as social media stocks were on the rise.
In 2013, SOCL managed to log in an impressive 63.99% gain on the year; compared to the dismal -0.37% return in 2012. And since its bottom in November in 2012, the fund managed to gain nearly 80% by the end of 2013.
EWM’s 17-Year Climb Back to the Top
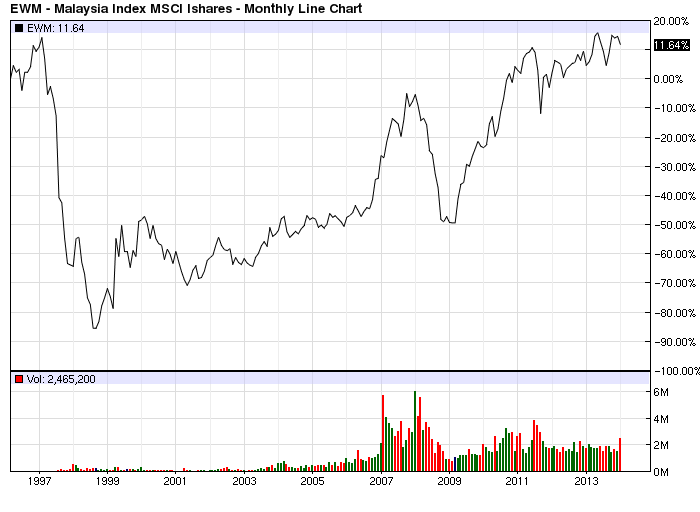
iShares’ MSCI Malaysia ETF (EWM ) is one of the oldest funds on the market, making its debut in 1996. Its underlying index is designed to measure the performance of the Malaysian equity market; the resulting portfolio consists of roughly 46 individual holdings.
During EWM’s first full year of trading, the fund reached a high of about $15.75 in February of 1997. Within a year, however, EWM took a steep tumble; with shares falling under the $2.00 mark.
From its low in October of 1998, EWM slowly gained ground over the next 10 years, rising to about $14 per share in 2008. The fund took yet another steep hit during the financial crisis, losing roughly half its value by 2009. From its low in 2009, EWM made yet another comeback, gaining 130% by the end of 2013.
IBB Takes Nearly a Decade to Pick Up the Pace
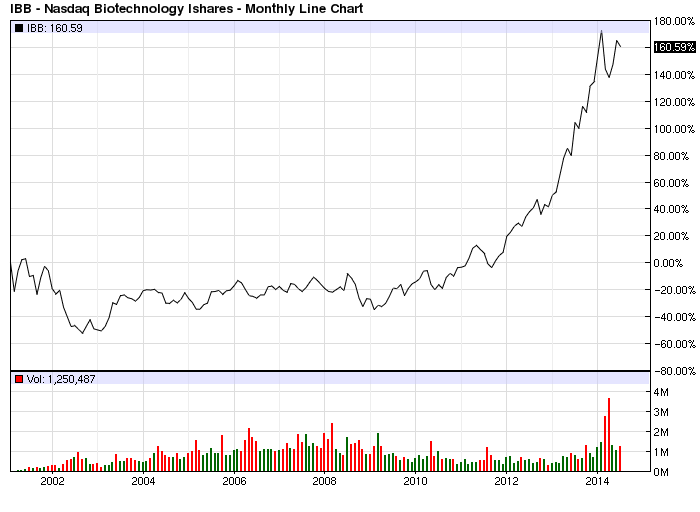
iShares’ Nasdaq Biotechnology ETF (IBB ) made its debut in February of 2001. It is designed to measure the performance of some of the largest and most well-known biotechnology and pharmaceutical companies.
During its first full year of trading, the fund struggled to find a definitive direction, exhibiting large and volatile price swings throughout the year. By the end of 2002, IBB had lost more than half of its value. From 2004 to 2007, the fund struggled to log in single-digit annual returns, and in 2008, the fund lost more than 12%
Since 2009, however, IBB has skyrocketed, gaining more than 200% by the end of 2013. Its best annual return also came in 2013, when the fund gained 65.54% [see How to take Profits and Cut Losses When Trading ETFs].
FDN Made Two Noteworthy Comebacks
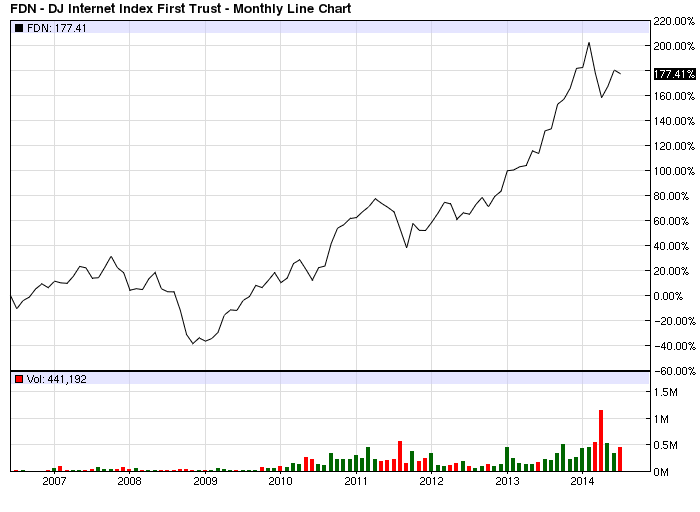
First Trust’s DJ Internet Index Fund (FDN ) was launched in June of 2006, making it one of the first products to specifically target “internet companies”. The fund’s portfolio consists of about 40 individual holdings.
During the fund’s first month of trading, FDN lost a little over 6%; the fund, however, managed to finish out the rest of 2006 on a positive note, gaining 10%. FDN saw similar gains in 2007, but during the 2008 crisis, the fund tumbled 44.11%. In 2009 and 2010, FDN gained momentum once again, logging in annual returns of 79.37% and 36.72%, respectively.
The fund struggled once again in 2011, posting a loss of 5.82%. Since then, however, FDN managed to gain roughly 70% by the end of 2013.
The Bottom Line
These five ETFs managed to not only recover from strings of bad losses, but also deliver great returns for those investors that were lucky enough to buy in at the lows. Though not all ETF “disasters” have a positive outcome, it is important to note that sometimes a severe pullback is needed before an ETF can really gain traction.
Be sure to follow us on Twitter @ETFdb

