
When it comes to value investing, there’s an important distinction between an asset’s apparent value and its actual value. Within the context of mutual funds and exchange-traded funds (ETFs), this distinction is made by examining the net asset value (NAV) and indicative net asset value (iNAV). Both help investors establish a point of reference when selecting which ETFs to include in their portfolios.
ETFs have quickly emerged as one of the biggest asset classes in the financial markets. By 2016, global ETF assets had exceeded $3 trillion. This figure is expected to top $7 trillion by 2021, as investors look to capitalize on the transparency, affordability and tax savings associated with ETFs. Presently, average daily turnover in some ETFs exceeds turnover in individual large-cap stocks. For example, ETFs like (SPY ), (GDX ) and (XLF ) experience daily volumes that are much larger than most of the large-cap volume leaders on the U.S. stock exchanges, including Bank of America (BAC), Cisco Systems Inc. (CSCO), Apple Inc. (AAPL) and Microsoft Corporation (MSFT). Investors can compare and contrast these ETFs using our Head-to-Head ETF Comparison tool, which allows for a granular analysis of performance, technical indicators, AUM, expenses, trading volume and more.
However, understanding daily trading volume is only one aspect of successful ETF investing. Knowing the difference between NAV and iNAV can have a far more profound impact on your investing portfolio. For starters, both indicators measure an ETF’s value at different intervals during the day as well as provide different points of reference for evaluating investment opportunities. Understanding how these indicators function can also benefit investors in terms of order execution, since an ETF’s intraday price and the fund’s NAV are largest at the beginning and end of each trading day. Read 6 Best Practices for Executing ETF Orders for tips on how to improve the quality of your ETF trading execution.
In order to get the most out of ETFs, there are many things that investors need to know about the structure, opportunities, and limitations of these securities. Read 101 ETF Lessons Every Financial Advisor Should Learn for more information.
Understanding NAV
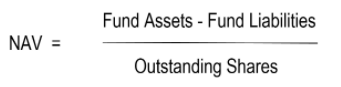
In ETF investing, the NAV represents the sum of a fund’s assets (i.e., its holdings of cash, shares, financial derivatives and other securities) minus any liabilities, divided by the total number of shares outstanding (see formula below). The NAV therefore gives the value per share of an ETF at a specific date. In North America, a fund’s NAV is calculated at 4 p.m. ET Monday through Friday.
Advantages and Disadvantages of NAV
The NAV is important because it provides an indication of the fair value of a single share within an ETF. This gives investors a reference point for gauging future investment decisions, such as whether to buy or sell shares in the fund. Although it’s easy to imagine a situation where someone offers you a significant premium over the NAV price, most ETFs track their NAV closely because of the creation/redemption mechanism. This mechanism, which explains how ETFs gain exposure to the financial markets, ensures a one-for-one fair-value exchange when an ETF company creates new shares of its fund through an Authorized Participant.
While extremely useful, a NAV also has significant shortcomings, especially when an ETF’s shares trade in a different time zone. These time zone differences can render a NAV obsolete because it does not account for fluctuating values in other markets. In this case, the value has changed but the NAV has remained the same. For example, the iShares Global 100 ETF (IOO ) provides exposure to 100 of the largest global stocks across developed and emerging markets, which can complicate the NAV calculation on any given day.
Relying on the NAV for trading also has several shortcomings, such as the impact of order size, direction and the market-maker’s own position on the cost of trading. Cut-off times for trading ETFs also vary based on the fund provider, which raises the cost and undermines the efficiency of trading. NAV trading may also result in settlement issues in countries or regions where negative interest rates are prevalent, such as Japan or the Eurozone. The FTSE Developed Markets ETF (VEA ) is one such fund that offers exposure to both Europe and Japan, as well as other regions.
Understanding iNAV
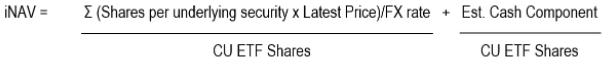
In addition to the once-a-day NAV indicator, investors use the iNAV to measure an ETF’s intraday value. The iNAV gives an updated or “real-time” measure of an ETF’s value based on its assets minus its liabilities. Since it is an unofficial indicator, it is usually calculated by third-party vendors and disseminated to the market every 15 seconds. The iNAV is calculated by multiplying the latest available price of each security in the calculation basket by the number of shares included in the basket (see formula below).
Advantages and Disadvantages of iNAV
Whereas the NAV informs investors about how much an asset is worth at the end of each trading day, the iNAV provides a more frequent snapshot. This makes the iNAV very useful for investors looking to buy or sell ETFs.
Like the NAV, the iNAV is also limited for ETFs with securities in multiple time zones, such as (IOO ) and (VEA ). This also applies when an Asian security trades on the New York Stock Exchange, or vice versa. Although 15-second updates may appear to be “real-time” information, these dissemination intervals can misrepresent the actual value of ETFs during volatile periods.
To overcome these challenges, some investors use a method called “fair valuation,” which involves using a proxy to ascertain the best estimate of fair value for securities that are not currently trading. A variation of this method is often used by liquidity providers. For example, a Tokyo-based liquidity provider trading an S&P 500 ETF while the New York Stock Exchange is closed might employ the S&P 500 futures contract as the basis for the calculation. The obvious benefit of this approach is that it overcomes stale calculations that plague NAV and iNAV indicators. The downside, however, could be large discrepancies between the “fair valuation” method and the official iNAV due to low liquidity in the futures market.
The Bottom Line
As an investor, being aware of NAV vs. iNAV can be critical. Despite its shortcomings, the net asset value of an ETF indicates how well the fund is positioned in the market. The iNAV, meanwhile, is a useful indicator for investors looking to trade an ETF, even though they may not reflect the true value in the case of funds with securities in multiple time zones.
For more ETF news and analysis, subscribe to our free newsletter. ETF investors should also consider signing up for the ETF Edge, so that you can not only stay updated on upcoming geopolitical events, but also on major portfolio-moving developments around the world.

