
Momentum traders looking for strong price movements to jump in on have embraced ETFs for their ease of use, cost efficiency, and sheer diversity of available products.
Typically, momentum trading setups will come in the form of trends, but they can also come from a shift in momentum such as strong buying after a sharp decline. Momentum strategies can be applied intraday, capitalizing on trends that occur within minutes or hours. Alternatively, they can be applied to take advantage of longer-term trends. Both price and indicator strategies are used to find momentum (or a lack of it) and can be applied to both bullish and bearish markets [see How To Swing Trade ETFs].
Relative Weakness Momentum Strategy – Bearish Momentum
Relative strength refers to how one ETF’s price movements compare to another’s. If two ETFs are dropping in a bear market and a trader wants to go short, they should short the weakest one, the ETF that nobody wants to own.
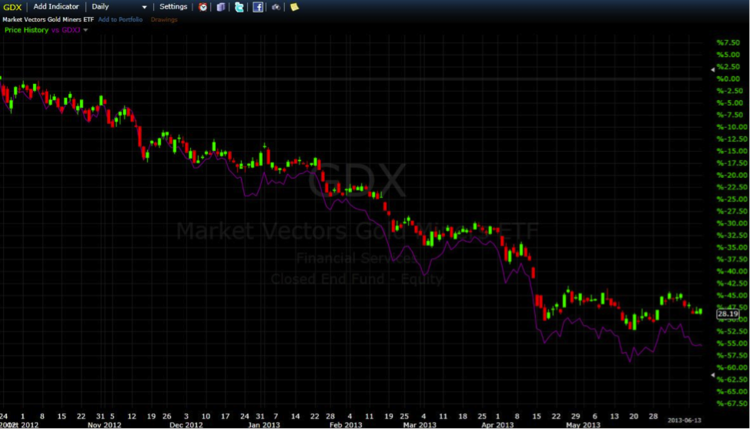
Let’s assume the trader is bearish on gold miners and wants to get a short position, but isn’t sure which gold miners ETF to short. They must do a comparison to see which is performing worst (in order to go short). To go long, our trader would look for the one that’s performing the best.
Figure 1. shows Market Vectors Gold Miners (GDX ) compared to Market Vectors Junior Gold Miners (GDXJ ). Over the timeframe shown, GDXJ has been weaker than GDX. If choosing between these two ETFs, taking a short in GDXJ is the better option since it’s weaker [see also How To Be A Better Bear: Short vs. Inverse ETFs].
To go short on the chosen ETF based on relative weakness, make sure an overall downtrend is in place, then look for entry. A simple but highly effective method is to draw a trendline along a pullback in the downtrend and then enter when the price resumes falling and breaks the trendline.
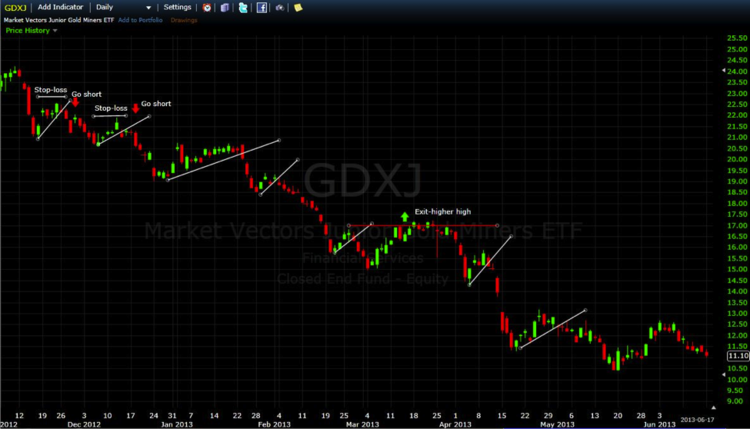
Figure 2. shows how many potential entry points there are in a strong downtrend. All the white lines are trendlines for pullbacks. When the trendline is broken it shows selling is continuing and a short position can be taken.
Place a stop above the recent high to limit risk, and hold the position until a higher swing high occurs.
This method can also be used in an uptrend. Look for the ETF that is performing the strongest in an uptrend. Draw downward trendlines along the pullbacks, and when the trendline is broken by buying, go long. Place a stop below the recent low and exit when a lower swing low occurs [see also 17 ETFs For Day Traders].
Momentum Indicator Strategy – Bullish Momentum
The following approach is best applied when the momentum indicator (12-day default) has recently reached an extreme level, such as 110 or higher, or 90 and lower. When it’s fluctuating back and forth mildly across 100, the signals are less reliable.
Extreme levels on the momentum indicator often signal that the price is over-extended and a turning point may soon be coming. Basing a decision on this alone can be dangerous, though, since prices can keep running for extended periods of time.
Therefore, we’re looking for an extreme level in the momentum indicator, followed by a divergence. In this particular case, we’re looking for an indication that strong selling is about to turn to buying. When it occurs, we can jump on the buying bandwagon [see 5 Most Important Chart Patterns For ETF Traders].
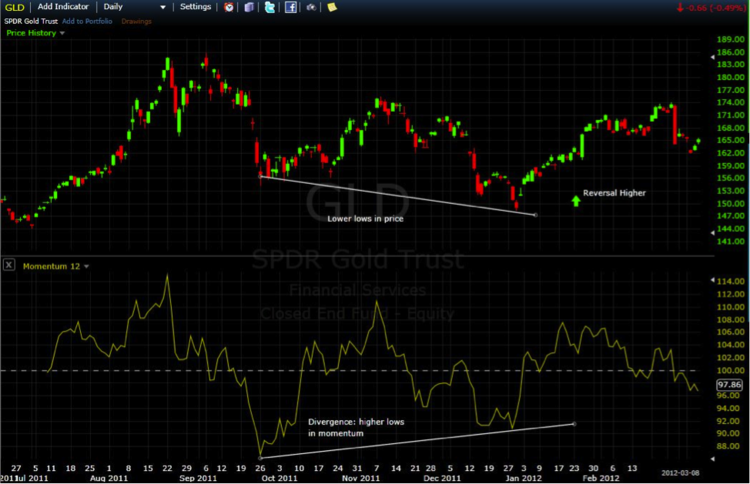
Figure 3. shows this sequence of events occurring in the SPDR Gold Trust (GLD ). As the price falls there is a downward spike in momentum, followed several months later by a higher low. This is divergence: the price is making lower lows but momentum is going up. This indicates that there is a potential long trade in the ETF, but the trade needs a trigger and risk controls.
Once the divergence is set up, a simple trade trigger is to draw a trendline on the momentum indicator and then enter long when the trendline is broken.
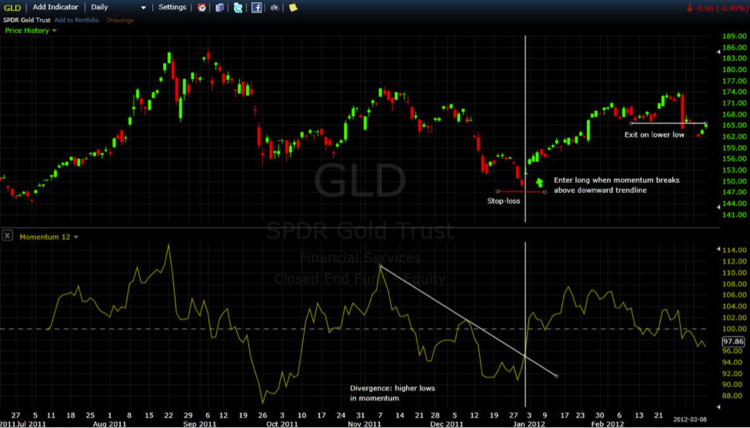
On this particular trade, the downward trendline following the divergence on the momentum indicator was broken almost exactly at the turning point of a higher price. This precision won’t always occur, so a stop-loss is needed. Place a stop below the recent low price, in this case $148.
Continue to hold the position as long as the ETF price is making higher lows. When a lower low occurs, which can be seen on the far right side of Figure 4., exit the trade.
This can also be used as a shorting strategy. Look for a buying spike followed by divergence on the momentum indicator (lower highs). Once it occurs, go short when the momentum indicator breaks below the upward trendline. The stop is above the recent high. Hold the position until a higher swing high occurs [see 3 ETF Trading Tips You Are Missing].
RSI Strategy – Neutral to Breakout Markets
Sometimes an ETF is predominantly trendless; it’s moving within a range. While this is often visually seen on the price chart, an RSI indicator can help confirm a range is occurring, and also notify traders when a trending move is beginning.
When an ETF’s price is moving back and forth within a price band for an extended period of time, the RSI (14-day period) will likely fluctuate between 80 and 20. If the trading is really choppy, the RSI may even stay snug to a 50 reading.
When the price is moving within a range and the RSI is fluctuating between 20 and 80 traders are better off with a ranging strategy rather than a momentum strategy.
Figure 5. shows this occurring in the United States Oil Fund (USO ). While there are opportunities to trade the see-saws in price, these are generally bypassed by momentum traders in favor of more dynamic moves.
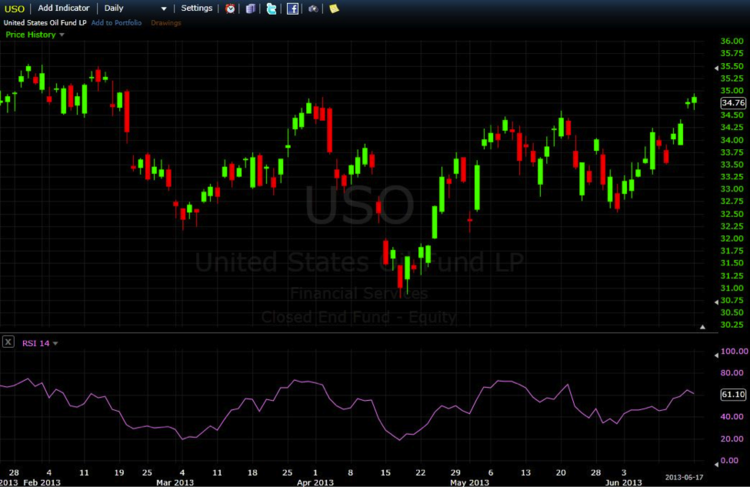
Wait for the RSI to move out of this range before taking momentum trades. Ideally, an uptrend in price should result in the RSI reaching above 80 and also staying above 40. In a price downtrend, the RSI typically dips below 20 and generally stays below 60.
USO showed these tendencies back in 2012.
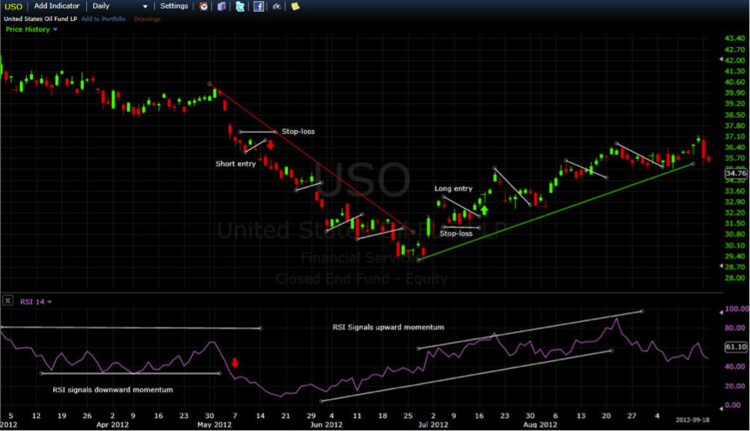
On the left-hand side of Figure 6. we see the price and RSI ranging. Here, both the RSI and price break prior lows, signaling increasing selling momentum and a downtrend. After reaching below 20, the RSI makes continual higher lows and higher highs into mid-August, showing a buying momentum. To enter a trade during the uptrend or downtrend, use the entry and risk control methods outlined in the Relative Strength/Weakness Momentum Strategy [see ETF Call And Put Options Explained].
The Bottom Line
Momentum strategies come in many forms and can be based on a price or an indicator. Apply momentum strategies in both up and down markets to maximize opportunity. During quiet and non-trending markets you’ll likely want to sit on the sidelines and await higher potential trades. When you’re trading momentum, the gains can be big, but so can the risks, as momentum can shift very quickly and severely. Control risk with a stop loss, and always trade with an exit plan in mind.
Disclosure: No positions at time of writing.

