
Pairs trading is a dynamic trading strategy any ETF trader can add to their playbook. Some traders use the strategy during volatile market conditions in an attempt to control risk, while others use it because they favor one investment over another but realize they could be wrong and want to hedge their bet. Still others use it simply when they don’t know whether to go long or short. With a basic understanding of pairs trading, investors can control risk while still reaping a profit.
With so many asset classes, sectors, countries and indexes available for trade, ETFs provide excellent pair trading candidates, but only if you know what to do.
Pairs Trading 101

Pairs trading typically involves trading two highly correlated assets. For example, the Dow Jones Industrial Average and the S&P 500 indexes typically move together, having a high correlation. Pairs traders look for deviations in this typical relationship and then attempt to exploit them. If the Dow moves higher while the S&P 500 drops, the trader takes a short position in the Dow and a long position in the S&P 500 [see How To Swing Trade ETFs].
The appeal is that it seems like a very low-risk strategy. Price fluctuations are often netted out since there is one long and one short position. By always taking a pair of positions, a long and a short, traders aren’t betting on direction, but rather on the eventuality that the two assets will gravitate back to their usual relationship. If the disconnected assets revert to a high correlation, the pairs traders reap a profit.
Unfortunately, markets are not always predictable. Assets that were correlated over the last several years may not be correlated tomorrow. Correlations are tendencies for assets to move together, but at any given time they can diverge. If the divergence lasts too long, or the assets continue to move further and further from each other, traders may be exposed to large losses. Therefore, while pairs trading is often called a “hedging strategy”, investors would be wise to put stop losses in place and utilize risk management tactics nonetheless [see also Free Report: How To Pick The Right ETF Every Time].
Trading highly correlated ETFs isn’t the only way to pairs trade. Another form of pairs trading exists in which traders will short one ETF and go long on another based on general market conditions, even though the two ETFs aren’t necessarily correlated [for more, see the section below on Sector Pairs].
Pairs Trading with ETFs
ETFs provide countless trade candidates. With loads of stock sectors, as well as bonds, oil, gold, silver, treasuries, international markets, and global and domestic indexes to choose from, ETF traders can find numerous opportunities while day trading or swing trading.
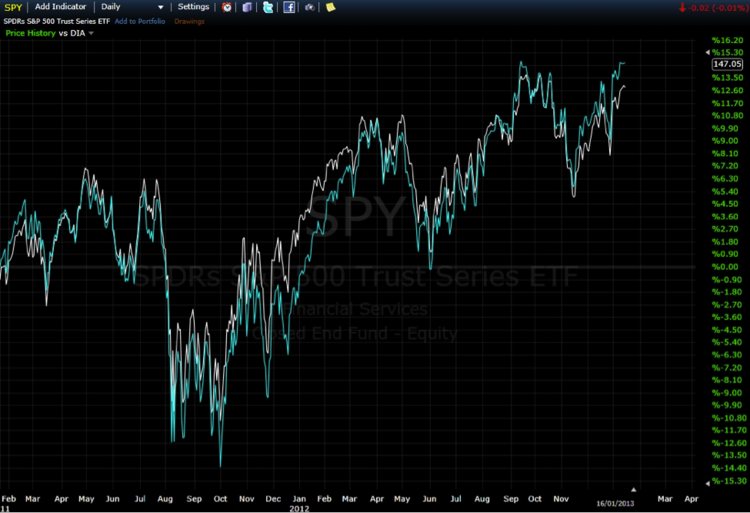
Consider our S&P 500 and Dow Jones index example. These indexes are highly correlated and both are tradable via ETFs: the S&P 500 SPDR (SPY ) and the Dow Jones Industrial SPDR (DIA ). In Figure 1, note the high correlation between the two ETFs. When the two separate, they generally reconnect, although that can take days or months.
ETF traders can also pair trade “competitive” ETFs. For example, the United States Oil Fund (USO ) and the Crude Oil Total Return Index (OIL ) often move in lockstep as they both track the price of oil, but occasionally they diverge. Such divergences offer an opportunity to short the stronger fund and go long on the weaker one, all the while relying on the correlation to reassert itself, resulting in a profit [see 5 Most Important Chart Patterns For ETF Traders].
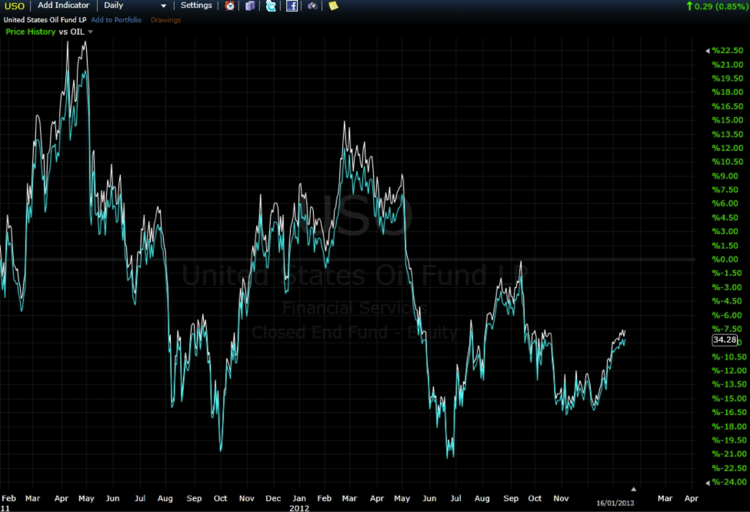
While the strategy seems simple, it is important to note any other tendencies between two potential ETFs. For example, OIL outperformed USO just slightly over the period shown, and this needs to be accounted for. If one asset is continually stronger than the other, then going long on the one with stronger tendencies and short on the one with weaker tendencies is often the better trading approach.
Sector Pairs
Certain sectors also share relationships with each other, although these are not always correlations. Rather, pair traders using sector ETFs rely more on each sector’s performance in a given economic climate.
For example, during troubled times the SPDR Utilities Select Sector Fund (XLU ) generally outperforms other, more speculative sectors, as investors move assets into more stable utility company stocks. Therefore, as panic gripped the market in 2007 and 2008 over financial worries, a pairs trader could have shorted the Financial Select Sector SPDR (XLF ) and gone long on XLU [see 17 ETFs For Day Traders].
On a much smaller scale, the same scenario occurred in the spring of 2012, as shown in Figure 3. XLF broke its uptrend and began to decline. The pairs trader could have seen this as an opportunity to short XLF and buy XLU; the assumption being that XLU would be stronger than the declining XLF. Held for just over a month, a profit would have been made on both positions.
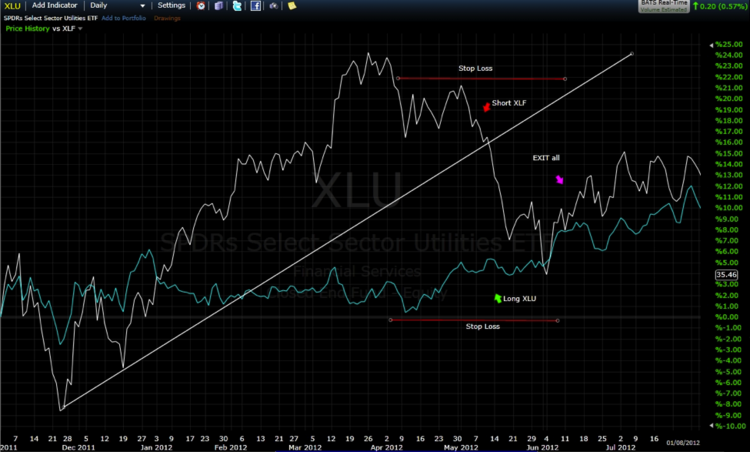
Traders must exit a position as soon as it appears that the trend may be changing. In June of 2012, XLF moved above the price high for May, indicating some strength. However, since the trade would’ve been based on XLF weakness, as soon as that ETF showed signs of strength the pairs trade would’ve had to be closed. Using a stop loss is recommended; appropriate levels are marked on the chart.
During different phases of the market cycle some sectors will perform better than others. Investors must monitor which sectors are hot, and look to buy those, while shorting those that are weak, all the while watching for reversals. A failur to monitor positions, or put a stop loss in place, can result in large losses if trends change.
Country Pairs
The stock markets of different countries are also tradable via ETF, providing many opportunities for pairs trading. ETFs such as the MSCI Japan Index (EWJ ), the MSCI Taiwan Index (EWT ), the MSCI Malaysia Index (EWM ) and the MSCI Singapore Index (EWS ) are all suitable for creating pairs trades [try our Free ETF Country Exposure Tool].
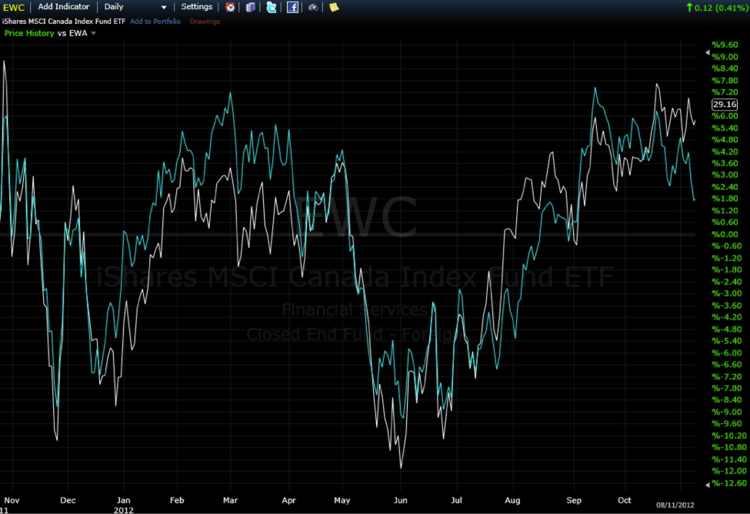
The MSCI Canada Index (EWC ) and the MSCI Australia Index (EWA ) usually share a very high correlation, as the two countries have similar economies. For ETFs that are highly correlated, often the best strategy is to go long on the weaker one and short the stronger one when the price trends diverge. This is based on the assumption that they will soon fall back in sync with each other.
Figure 4 shows that throughout much of 2012 the ETFs traded in sync, but at times separated. Shorting the stronger and buying the weaker fund at such times always resulted in a profit (eventually) as the two ETFs converged once again.
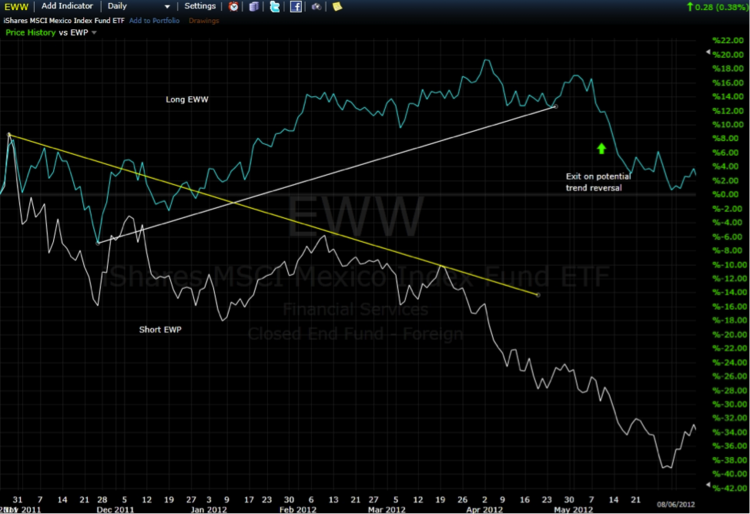
Another option is trading based on strength and weakness. For example, in early 2012 Mexico (EWW ) was a hot market, while Spain (EWP ) was not. Going long on Mexico and short on Spain would have been a very profitable pairs trade, resulting in significant profits.
Index Pairs
There are many indexes that can be used to pairs trade as well. Indexes track commodity prices, bonds, small-cap and large-cap stock, as well as global markets. By watching indexes a trader can determine which asset classes have money flowing into and out of them [see 3 ETF Trading Tips You Are Missing].
Pairs traders take advantage of this by buying a strong index and shorting a weak index.
Investors saw 2012 begin with large-cap stocks, represented by the SPDR Dow Jones Industrial Average (DIA ), moving higher in a strong uptrend. The Barclays 20 Year Treasury Bond Fund (TLT ), on the other hand, was moving lower. To capitalize, a pairs trading strategy would’ve involved going long on DIA while shorting the weaker TLT.
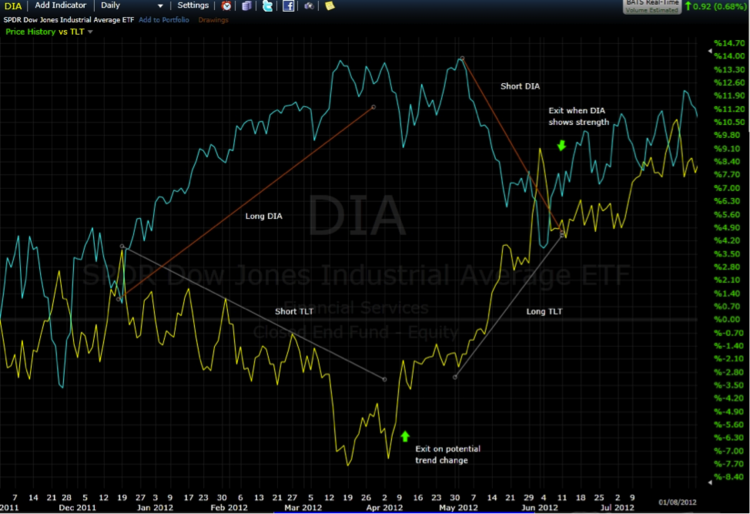
From January to March the trade produced profits. Come April though, trends began to reverse. The pairs trade is exited as TLT (only one ETF needs to show signs of a reversal) creates a higher low and then moves even higher. The pairs trade is then reversed: a long position is taken in the strengthening TLT and a short position taken in the weakening DIA. Once again, stops are used or the trends are closely monitored, as it is possible to lose on both positions if trends suddenly shift [see 5 Important ETF Lessons In Pictures].
The Bottom Line
Employing an ETF pairs strategy may be useful when there is a disconnect between assets that are usually highly correlated. Sector, country, and index ETFs also provide opportunities for the pairs trader, usually involving going long on a strong ETF and short on a weaker one. It’s important to exit the trades when the assets realign or the trends of strong and weak assets reverse. It would also be wise to set a loss limit on each trade, and realize that markets are dynamic; relationships that existed yesterday may not necessarily exist tomorrow.
[For more ETF analysis, make sure to sign up for our free ETF newsletter]
Disclosure: No positions at time of writing.

