

While there were no cuts by index constituents, there were some cuts from other MLPs for the quarter. American Midstream (AMID) cut its distribution by 75.0%, and Blueknight Energy Partners (BKEP) cut its distribution by 44.8%.
Notable Q/Q data points for the AMZ…
Hi-Crush Partners (HCLP) saw the largest distribution growth in the AMZ Index, growing its distribution by 233.3%. That’s not a typo! HCLP’s partnership agreement includes an incentive distribution right (IDR) reset provision with four straight quarters of distributions greater than $0.7125. The higher distribution could pave the way for a potential conversion to a C Corporation, though there are alternative routes as well. CVR Refining (CVRR), a variable distribution MLP, saw the next highest sequential growth at 29.4%. Another variable distribution MLP Viper Energy Partners (VNOM) rounds out the list of AMZ constituents with double-digit distribution growth, with its 2Q18 distribution representing a 25.0% increase from the prior quarter. The three double-digit growers are in non-traditional MLP businesses – frac sand, refining, and mineral interests, respectively. These companies are not included in the AMZI, which is limited to infrastructure MLPs.
And AMZI.
Three constituents of the AMZI Index grew their distribution by more than 4% sequentially. Antero Midstream (AM) saw the greatest distribution growth – a 6.4% increase from $0.39 to $0.415 per unit. Phillips 66 Partners (PSXP) grew its distribution by 5.3% to $0.752 per unit, while Shell Midstream (SHLX) grew its distribution by 4.9% to $0.365 per unit. What do these three constituents have in common? Their general partners have IDRs, and they are in the high splits. It’s not a coincidence that the MLPs with the higher growth have IDRs – they are effective for incentivizing distribution growth. That said, the trend in the MLP space has been to eliminate IDRs by buying out the GP’s IDRs or through restructuring transactions as IDRs eventually become a burden to the cost of capital. Consistent with past commentary, PSXP management noted on their 2Q earnings call that they would need to deal with their IDRs at some point and acknowledged a shortened lifecycle for IDRs.
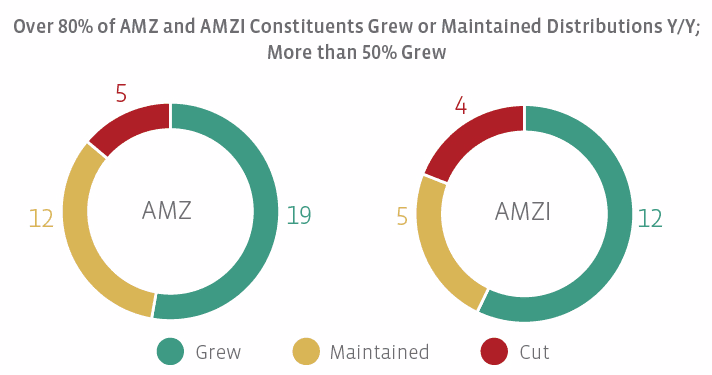
Year-over-year Growth May Surprise You
The charts below compare the 2Q18 distribution with the 2Q17 distribution for those names that were in the index in both periods. Please note that this method introduces survivorship bias. Again, we included WPZ in this analysis because it was in the indices when its 2Q18 distribution was declared and when the record date occured but was subsequently removed. On a year-over-year basis, seven MLPs grew their distribution by 20% or more. All seven have IDRs in their structure, though Dominion Midstream (DM) announced an IDR reset at the end of June.
Names that maintained their distribution in 2Q18 relative to 2Q17 include (names with an asterisk also in the AMZI):
AmeriGas Partners (APU)- Buckeye Partners (BPL)
- Crestwood Equity Partners (CEQP)
- DCP Midstream (DCP)
- Enbridge Energy Partners (EEP)
- Enable Midstream Partners (ENBL)
- EnLink Midstream Partners (ENLK)
Golar LNG Partners (GMLP)- *NGL Energy Partners (NGL)
Summit Midstream Partners (SMLP)
Sunoco (SUN)
Teekay LNG Partners (TGP)
Constituents with a year-over-year decrease in distributions due to cuts made prior to 2Q18 include Genesis Energy (GEL), NuStar Energy (NS), Plains All American (PAA), Suburban Propane (SPH), and TC Pipelines (TCP).
The Evolution of Distribution Growth
The side-by-side snapshot below of year-over-year distribution growth from 2Q18 and 2Q17 (which compares against the 2Q16 distribution) is a simplified way of looking at distribution growth but packs interesting takeaways for individual MLPs and the space nonetheless. For companies like EQM, MMP, WES, and SEP, the charts show impressive consistency. Higher rates of year-over-year growth in 2Q18 may reflect the improved macro environment in 2018 – higher oil prices, higher US oil and natural gas production, and growing exports. More moderate distribution growth reflects the shift to equity self-funding for companies like Enterprise Product Partners (EPD). On the other hand, MPLX (MPLX) saw greater year-over-year growth in 2Q18 than 2Q17 even with its pursuit of self-funding and the elimination of its IDRs likely due to the major drop down transaction completed in 1Q18.
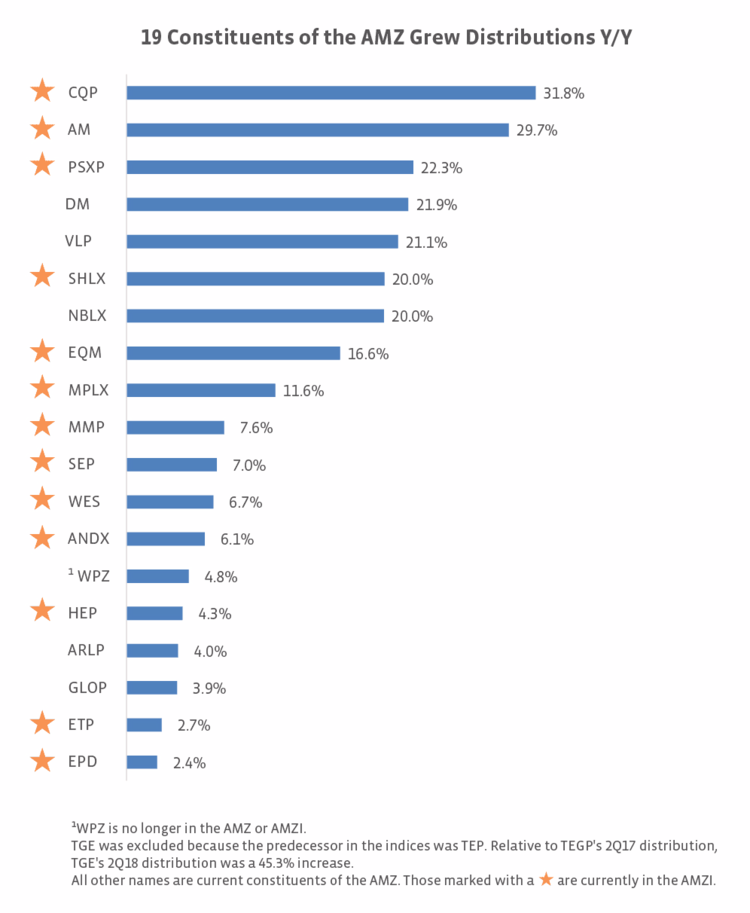
There are several broader observations to make. Those MLPs with IDRs tend to have higher distribution growth – note the change in growth for Andeavor Logistics (ANDX) from the mid-teens in 2Q17 to 6.1% growth in 2Q18 (IDR elimination was completed in October 2017). While many MLPs were generating 6-10% year-over-year growth in 2Q17, that range of growth has become less crowded in 2Q18. Growth seems to have more of a barbell profile in 2Q18, with several high growers and several modest growers. Interestingly, roughly the same total number of MLPs in the AMZ achieved year-over-year growth in 2Q18 (19 including WPZ) and 2Q17 (20). Names like TCP and GEL that were growers in 2Q17 were excluded from the 2Q18 chart following distribution cuts. Similarly, WPZ does not appear in the 2Q17 chart because of a 1Q17 distribution cut.
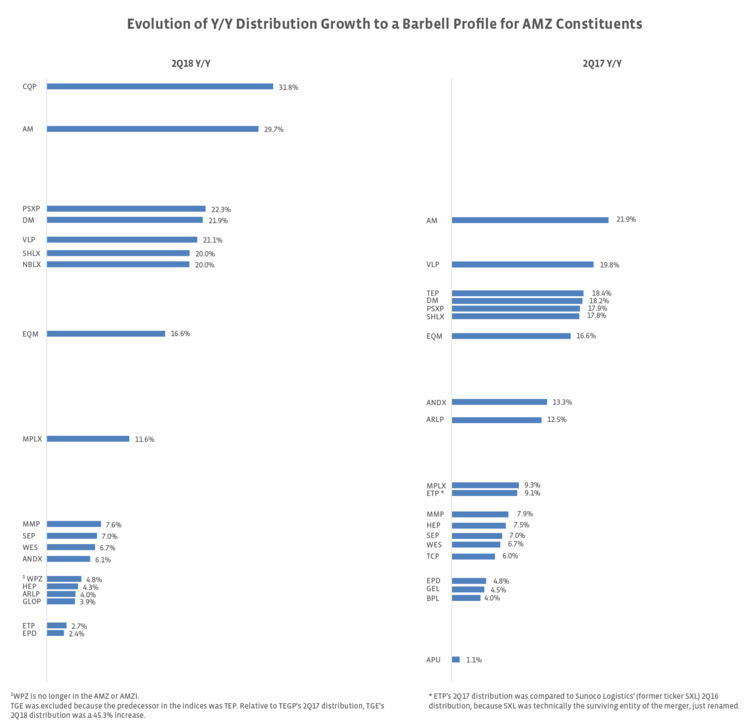
While looking at 2Q year-over-year growth for 2017 and 2018 is a little like watching a movie on a cell phone compared to a big screen, it does show some interesting trends. Comparing 2Q18 to 2Q17, the high-growth MLPs are seeing steeper growth, while more names achieved year-over-year growth below 7.0%. As we’ve talked about in the past, the MLP space is generally leaving behind the old convention of 6-8% annual distribution growth in favor of more conservative, sustainable distribution growth and stronger financial positioning. Has this translated to improved coverage ratios for the space? Stay tuned for next week when we will look at distribution coverage for AMZI constituents.
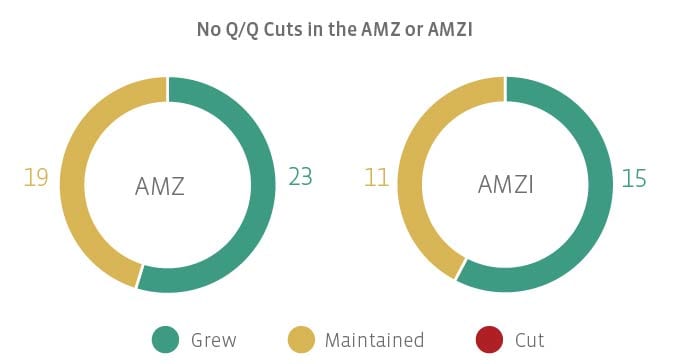
Correction: Please note that the first chart (No Q/Q Cuts in the AMZ or AMZI) was labeled incorrectly and has been updated for accuracy on August 31, 2018.

