
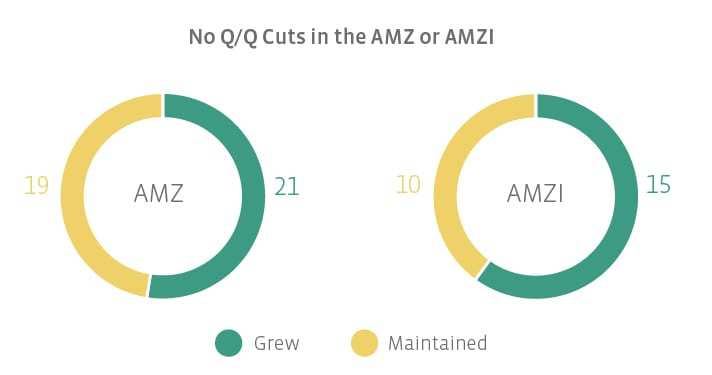
AMZ and AMZI Q/Q Fun Facts
Viper Energy Partners (VNOM), a variable distribution MLP, had the highest quarter over quarter increase in the AMZ. The company raised its distribution from $0.337 to $0.460 or 36.5%.- In the AMZI, Antero Midstream Partners (AM) had the highest increase, raising from $0.340 to $0.365 or 7.35%.
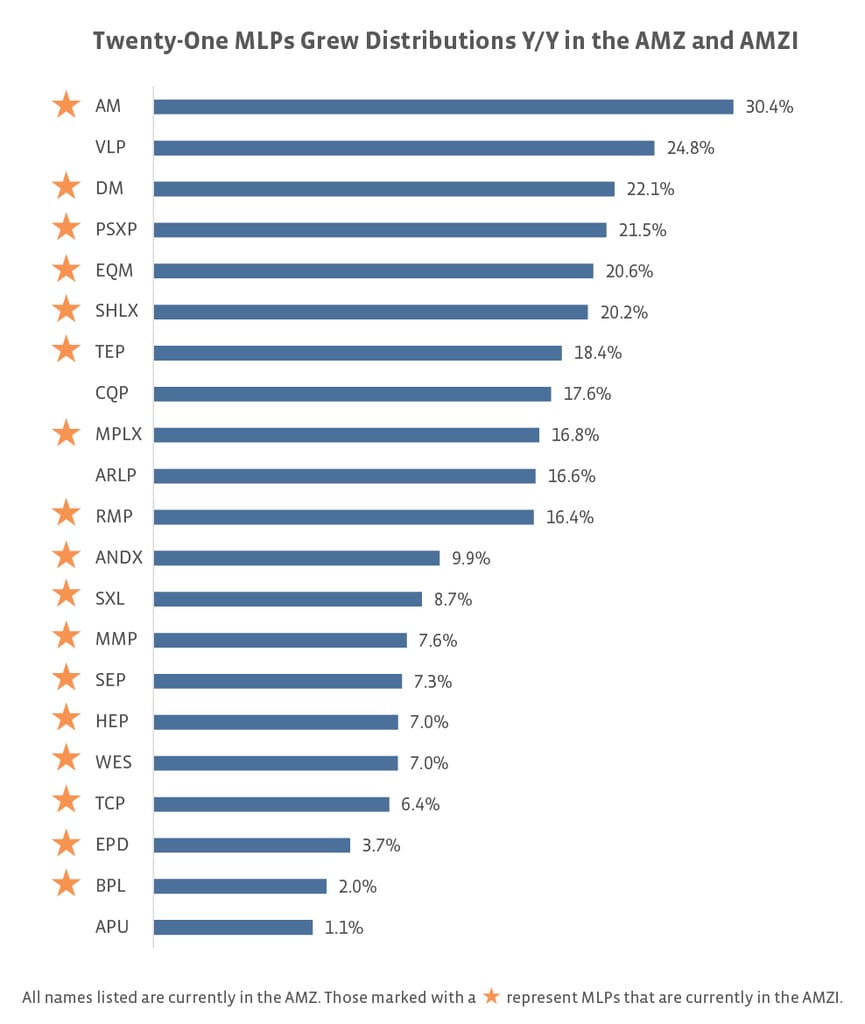
- In the AMZ, Including VNOM and AM, there were five companies that increased distributions by 5% or more: Cheniere Energy Partners (CQP), Valero Energy Partners (VLP), and Dominion Midstream Partners (DM).
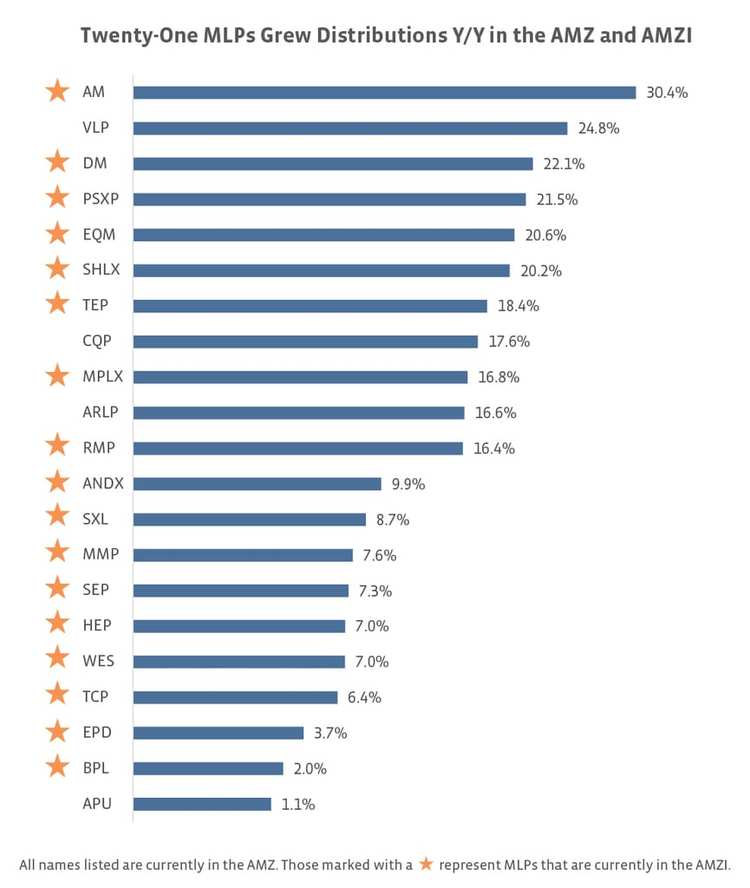
- Of the 15 MLPs that grew distributions in the AMZI, five increased payouts by 4% or more: AM, DM, Phillips 66 Partners (PSXP), Shell Midstream Partners (SHLX), and EQT Midstream Partners (EQM).
Next, we have the year-over-year data, which compares 4Q16 and 4Q17. If the name was in the index in both 4Q16 and 4Q17, I compared the distributions. Please note there is survivorship bias in this method.

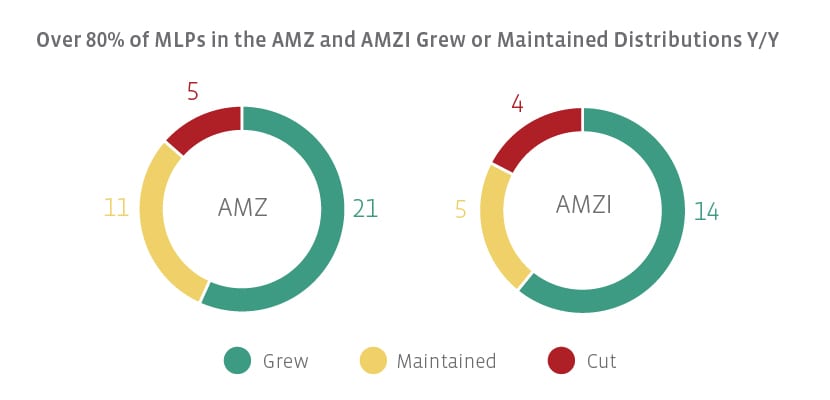
- Names that maintained year over year (all names listed are in the AMZ, those with a * represent MLPs that are also in the AMZI):
Boardwalk Pipeline Partners (BWP)
Crestwood Equity Partners (CEQP)
DCP Midstream Partners (DCP)
Enable Midstream Partners (ENBL)
EnLink Midstream Partners (ENLK)
Golar LNG Partners (GMLP)
NGL Energy Partners (NGL)
NuStar Energy (NS)*
Summit Midstream Partners (SMLP)
Sunoco (SUN)
Teekay LNG Partners (TGP)
Those that cut year over year were Plains All American Pipeline (PAA), Enbridge Energy Partners (EEP), Suburban Propane Partners (SPH), Williams Partners (WPZ), and Genesis Energy (GEL).
While 4Q17 represented a cut-free quarter for the constituents of the AMZ and AMZI, we would be remiss to not mention a forthcoming cut. NS has announced plans to reset its distribution to $0.60 per unit per quarter beginning with the 1Q18 distribution, a decrease from the 4Q17 distribution of $1.095 per unit.
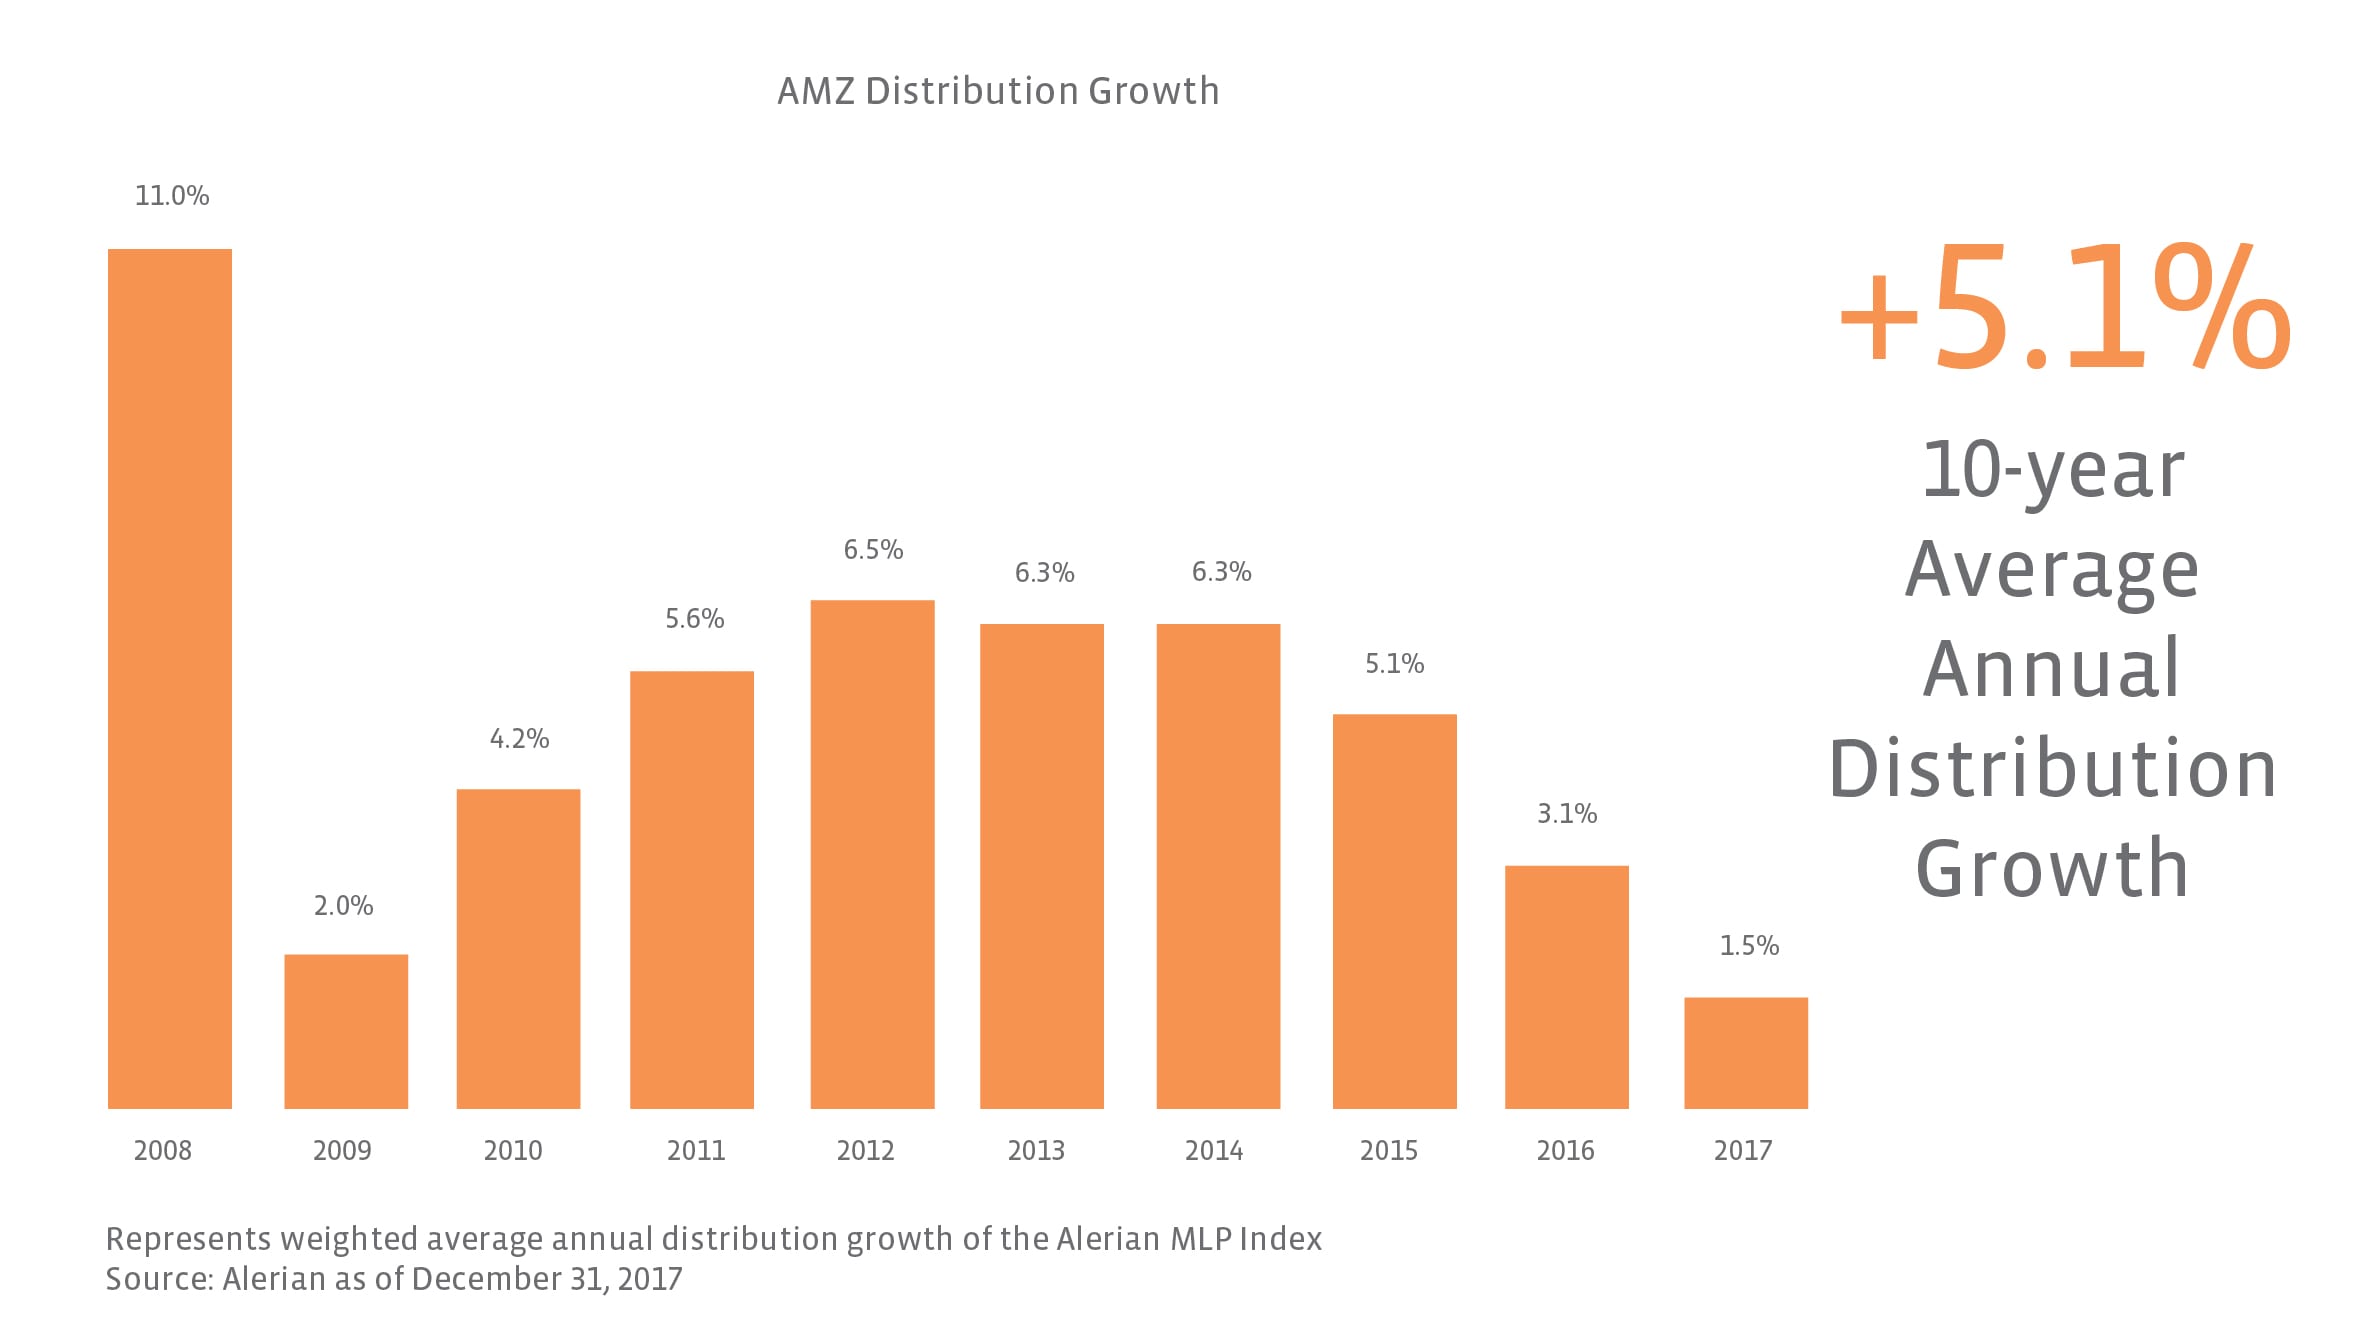
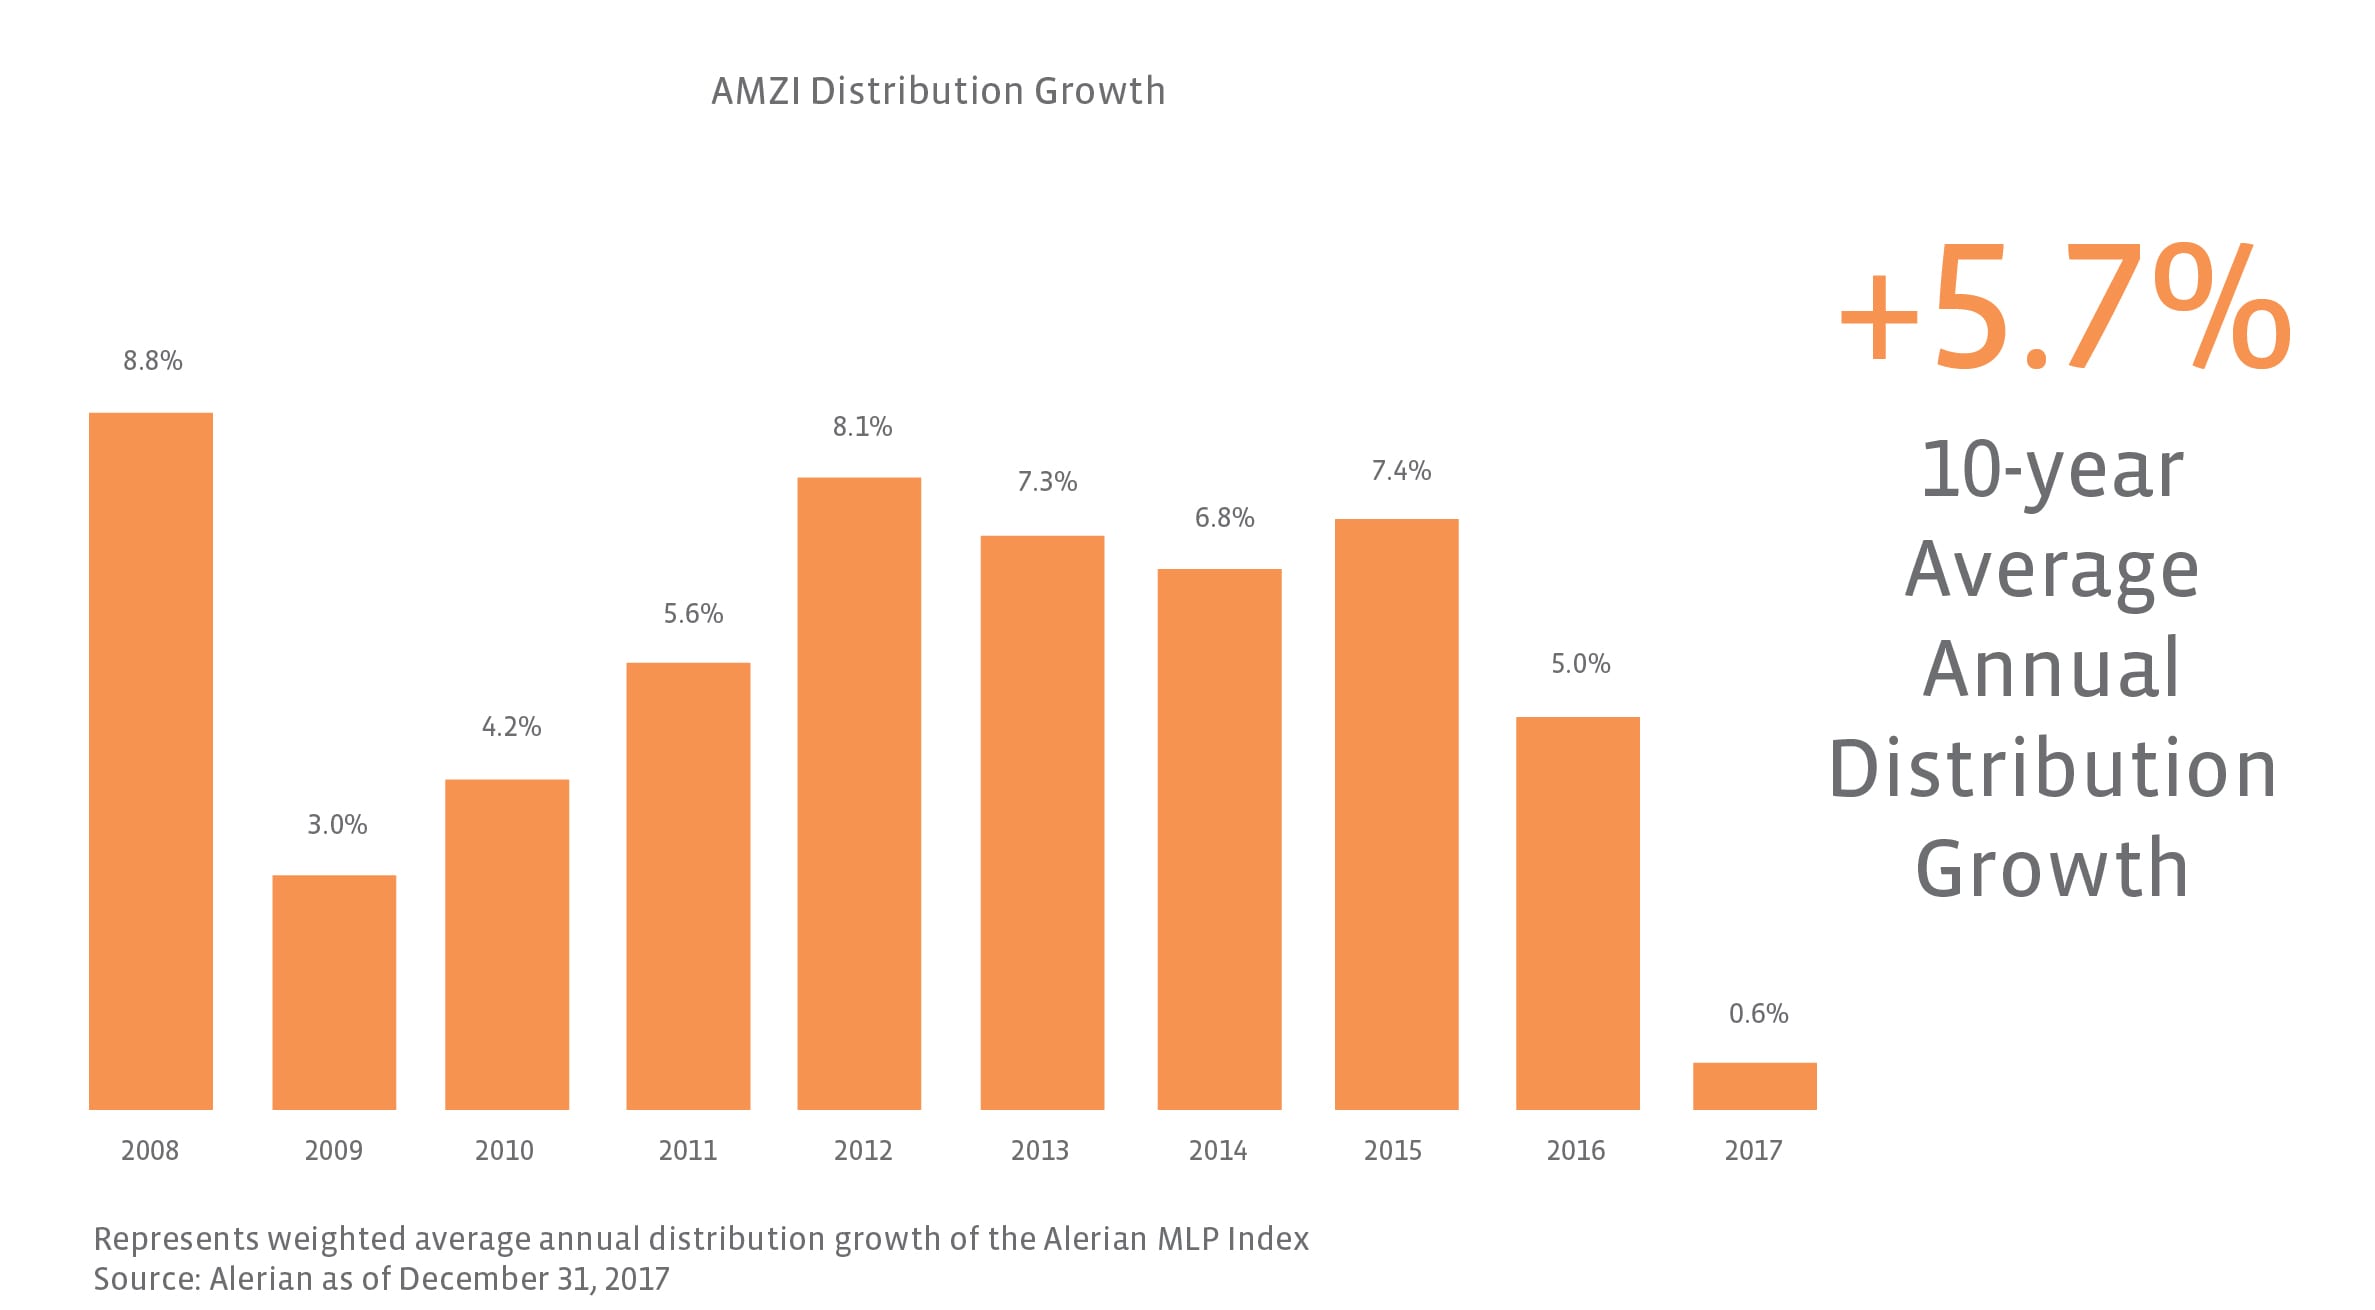
Most MLPs are still choosing to grow or maintain their distribution versus cut; thus, on a full-year basis, our distribution growth charts for AMZ and AMZI continue to show y/y growth. Notably, we’ve received a lot of questions about the methodology used to calculate distribution growth. While we have addressed this in a previous post, because it has, previously unbeknownst to us, been referenced in marketing materials by others, we want to make it clear that there are other methods for calculating distribution growth, which we will address in a future Insights post.
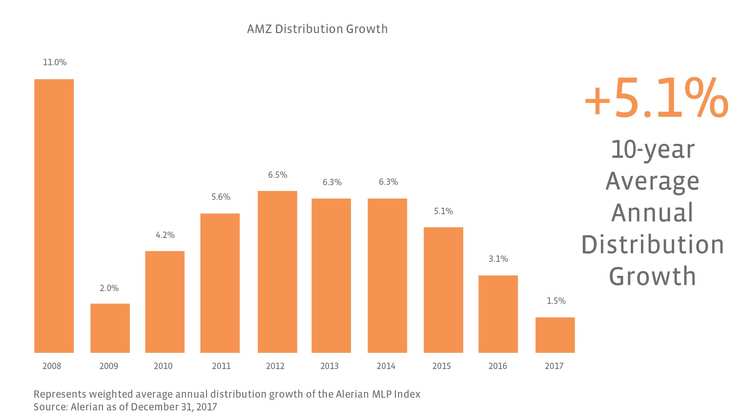
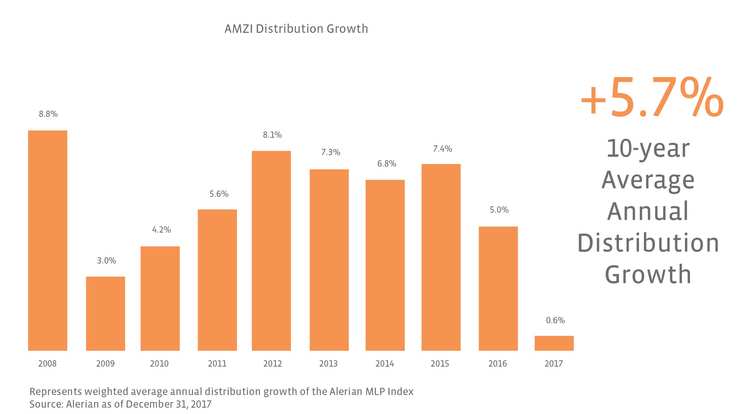
As we move forward, we continue to expect that the market will reward capital discipline. Though there are exceptions (dropdown stories), the MLP sector in general is leaving behind the old convention of 6-8% annual distribution growth (when factoring in organic and acquisition growth) in favor of more conservative distribution growth and stronger balance sheets, as shown in the charts. We’ll continue to review distributions each quarter and post the analysis for our readers as a tool for making informed decisions about MLP and energy infrastructure investments.

