ETFdb Logo
ETFdb Logo
  • ETF Database
  • Channels
    • Themes
      • Active ETF
      • Artificial Intelligence
      • Beyond Basic Beta
      • China Insights
      • Climate Insights
      • Core Strategies
      • Crypto
      • Direct Indexing
      • Disruptive Technology
      • Energy Infrastructure
      • ETF Building Blocks
      • ETF Investing
      • ETF Education
      • ETF Strategist
      • Financial Literacy
      • Fixed Income
      • Free Cash Flow
      • Innovative ETFs
      • Institutional Income Strategies
      • Leveraged & Inverse
      • Managed Futures
      • Market Insights
      • Modern Alpha
      • Multifactor
      • Responsible Investing
      • Retirement Income
      • Tax Efficient Income
    • Asset Class
      • Equity
        • U.S. Equity
        • Int'l Developed
        • Emerging Market Equities
      • Alternatives
        • Commodities
        • Gold/Silver/Critical Minerals
        • Currency
        • Volatility
      • Fixed Income
        • Investment Grade Corporates
        • US Treasuries & TIPS
        • High Yield Corporates
        • Int'l Fixed Income
    • ETF Ecosystem
    • ETFs in Canada
  • Tools
    • ETF Screener
    • ETF Country Exposure Tool
    • ETF Sector Tracker Tool
    • ETF Database Categories
    • Head-To-Head ETF Comparison Tool
    • ETF Stock Exposure Tool
    • ETF Issuer Fund Flows
    • Indexes
    • Mutual Fund To ETF Converter
  • Research
    • ETF Education
    • Equity Investing
    • Dividend ETFs
    • Leveraged ETFs
    • Inverse ETFs
    • Index Education
    • Index Insights
    • Top ETF Sectors
    • Top ETF Issuers
    • Top ETF Industries
  • Webcasts
  • Themes
    • AI ETFs
    • Blockchain ETFs
    • See all Thematic Investing ETF themes
    • ESG Investing
    • Marijuana ETFs
  • Multimedia
    • ETF 360 Video Series
    • ETF of the Week Podcast
    • ETF Prime Podcast
    • Video
  • Company
    • About VettaFi
    • Get VettaFi’ed
  • PRO
    • Pro Content
    • Pro Tools
    • Advanced
    • FAQ
    • Pricing
    • Free Sign Up
    • Login
  1. Index Insights
  2. Alerian Rebalancings: What Happens to MLPs That Are Added?
Index Insights
Share

Alerian Rebalancings: What Happens to MLPs That Are Added?

Karyl PatredisDec 12, 2016
2016-12-12

It’s been a little over a year since we last talked about the Alerian Effect. If you’re wondering what I mean by “Alerian Effect,” I’m simply referring to what happens to an MLP as a result of being added to an Alerian index. Today, we’re going to do a bit of a refresher on some of the information we’ve presented in previous posts. I’ll add the latest data into the mix and we’ll walk through what happens to an MLP’s performance the day it is announced it’ll be added to the Alerian MLP Index (AMZ) or the Alerian MLP Infrastructure Index (AMZI). We’ll also look beyond the day we announce index changes to the day after the rebalancing takes place.

Okay, let’s start with a calendar so you can understand the time periods I’ll be discussing. If you don’t work here, I’m guessing you don’t have our quarterly rebalancing patterns memorized. Here is how the quarterly rebalancing events shook out this past September:

This is the image alt text

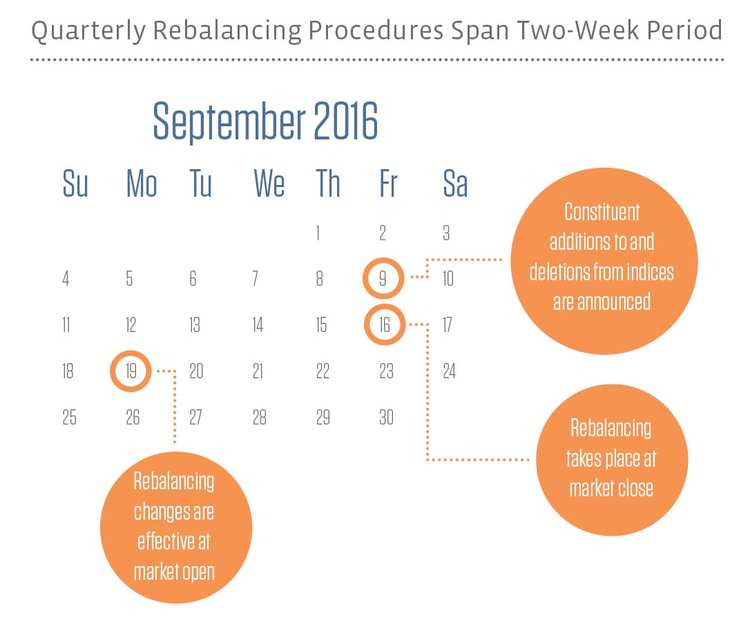
Quarterly rebalancings to the Alerian Index Series occur every March, June, September, and December. Results are announced on the second Friday, actual rebalancings take place on the third Friday after market close, and changes are effective at market open the following Monday. Special rebalancings are reviewed on a case-by-case basis; thus, we are unable to offer an easy-to-follow calendar because they are triggered by corporate actions.

The study period for the charts discussed in this post run from the 2011 Q1 rebalancing to the 2016 Q3 rebalancing. The data includes both quarterly and special rebalancings, but please note that under our current methodology names are no longer added to the indices during special rebalancings.

An MLP that is added to the AMZ or AMZI typically outperforms the index it was added to on the day the announcement was made. This is somewhat to be expected as about $3.6 billion of linked product tracks the AMZ and $12.3 billion tracks the AMZI. Investors expect the product providers will need to purchase a certain amount of the MLP’s units, thereby increasing demand and price of the MLP’s units. MLPs new to the AMZI tend to outperform by 307 bps compared to AMZ names’ 156 bps likely due to more AUM tracking the AMZI.


Content continues below advertisement

2016.09.16_the_alerian_effect_-_entering-01

Performance on the date of announcement is one way to look at the Alerian effect. If you took a longer time frame, such as from the announcement date until one trading day after the rebalancing date, the results get more perplexing.

Keep in mind the numbers during this time period represent relative outperformance/underperformance versus the index, not the absolute performance of the MLPs over the time period. The trouble here is that the results don’t make that much sense. While the average over the time period is outperformance of 44 bps, constituents added to the AMZ actually (on average) underperform the index through the day after rebalancing by around 100 bps, whereas constituents added to the AMZI outperform by 368 bps. The “X”s in the chart below signify the relative performance of an entering MLP on the day of announcement, while the diamonds represent how an MLP performs relative to the index on the day of announcement through the close of the trading day after the rebalancing.

2016.09.16_the_alerian_effect1-01

Now, while the average underperformance for the AMZ is a bit confusing, when broken out on a per MLP basis, the majority of MLPs in both the AMZ and the AMZI outperformed on the announcement date and through the day after rebalancing during the 1Q 2011 to 3Q 2016 study period.

This is the image alt text

In looking at the results of this study, we’ve searched for possible trends behind the data. Is it possible that although the Alerian indices are rules-based and formulaic, this medium-term effect could be due to investors mistakenly believing that adding a company to an index implies Alerian approval or recommendation of that MLP? Or, could it be because investors understand the methodology and believe any MLP that qualifies for an Alerian index has passed a minimum bar for investment? Another possibility with MLPs that experienced significant outperformance or underperformance is that the market incorrectly speculated the results of the rebalancing.

In reality, we may never know the exact reason the chips fall as they do. What we do know is that if you have questions surrounding the Alerian rebalancings, please make sure you’ve read our methodology guides (AMZ and AMZI). If you still have questions, check out this great post our CEO wrote that walks readers through a portion of the 2Q 2016 rebalancing. And if you still have lingering confusion, remember that you can always email me at index@alerian.com.

Next week, we’ll look at the same data, but for MLPs existing an index.

» Popular Pages

  • Tickers
  • Articles

Sep 29

A Fixed Income Primer for Constructing Portfolios

Sep 29

Main Management Market Note: September 29, 2023

Sep 29

Higher for Much Longer?

Sep 29

Moving Averages: S&P Ends September Down 4.9%

Sep 29

This Week in ETFs: FormulaFolios Renamed & Adds New Funds

Sep 29

Play Online Car Sales News in These 2 China ETFs

Sep 29

SEC Opens Ethereum Futures ETF Floodgates

Sep 29

VettaFi Voices On: Managing Risk in an Uncertain Economy

Sep 29

SPYI Outperforms SPY in Challenging 3rd Quarter

Sep 29

More Rate Hikes? Watch Treasury ETF USFR

QQQ

Invesco QQQ Trust Series I

SPY

SPDR S&P 500 ETF Trust

VOO

Vanguard S&P 500 ETF

JEPI

JPMorgan Equity Premium...

TLT

iShares 20+ Year Treasury...

SCHD

Schwab US Dividend Equity ETF...

SMH

VanEck Semiconductor ETF

VGT

Vanguard Information...

VTI

Vanguard Total Stock Market...

XLK

Technology Select Sector SPDR...

Loading Articles...
Our Sites
  • VettaFi
  • Advisor Perspectives
  • ETF Trends
Tools
  • ETF Screener
  • Mutual Fund to ETF Converter
  • Head-To-Head ETF Comparison
  • ETF Country Exposure Tool
  • ETF Stock Exposure Tool
  • ETF Database Pro
More Tools
  • Financial Advisor & RIA Center
Explore ETFs
  • ETF News
  • ETF Category Reports
  • Premium Articles
  • Alphabetical Listing of ETFs
  • Browse ETFs by ETF Database Category
  • Browse ETFs by Index
  • Browse ETFs by Issuer
  • Compare ETFs
Information
  • Contact Us
  • Terms of Use and Privacy Policy
  • © 2023 VettaFi LLC. All rights reserved.

Advertisement

Is Your Portfolio Positioned With Enough Global Exposure?

ETF Education Channel

How to Allocate Commodities in Portfolios

Tom LydonApr 26, 2022
2022-04-26

A long-running debate in asset allocation circles is how much of a portfolio an investor should...

Core Strategies Channel

Why ETFs Experience Limit Up/Down Protections

Karrie GordonMay 13, 2022
2022-05-13

In a digital age where information moves in milliseconds and millions of participants can transact...

}
X