ETFdb Logo
ETFdb Logo
  • ETF Database
  • Channels
    • Themes
      • Active ETF
      • Artificial Intelligence
      • Beyond Basic Beta
      • China Insights
      • Climate Insights
      • Core Strategies
      • Crypto
      • Direct Indexing
      • Disruptive Technology
      • Energy Infrastructure
      • ETF Building Blocks
      • ETF Investing
      • ETF Education
      • ETF Strategist
      • Financial Literacy
      • Fixed Income
      • Free Cash Flow
      • Innovative ETFs
      • Institutional Income Strategies
      • Leveraged & Inverse
      • Managed Futures
      • Market Insights
      • Modern Alpha
      • Multifactor
      • Responsible Investing
      • Retirement Income
      • Tax Efficient Income
    • Asset Class
      • Equity
        • U.S. Equity
        • Int'l Developed
        • Emerging Market Equities
      • Alternatives
        • Commodities
        • Gold/Silver/Critical Minerals
        • Currency
        • Volatility
      • Fixed Income
        • Investment Grade Corporates
        • US Treasuries & TIPS
        • High Yield Corporates
        • Int'l Fixed Income
    • ETF Ecosystem
    • ETFs in Canada
  • Tools
    • ETF Screener
    • ETF Country Exposure Tool
    • ETF Sector Tracker Tool
    • ETF Database Categories
    • Head-To-Head ETF Comparison Tool
    • ETF Stock Exposure Tool
    • ETF Issuer Fund Flows
    • Indexes
    • Mutual Fund To ETF Converter
  • Research
    • ETF Education
    • Equity Investing
    • Dividend ETFs
    • Leveraged ETFs
    • Inverse ETFs
    • Index Education
    • Index Insights
    • Top ETF Sectors
    • Top ETF Issuers
    • Top ETF Industries
  • Webcasts
  • Themes
    • AI ETFs
    • Blockchain ETFs
    • See all Thematic Investing ETF themes
    • ESG Investing
    • Marijuana ETFs
  • Multimedia
    • ETF 360 Video Series
    • ETF of the Week Podcast
    • ETF Prime Podcast
    • Video
  • Company
    • About VettaFi
    • Get VettaFi’ed
  • PRO
    • Pro Content
    • Pro Tools
    • Advanced
    • FAQ
    • Pricing
    • Free Sign Up
    • Login
  1. Index Insights
  2. Do You Have Historical MLP Classification Data?
Index Insights
Share

Do You Have Historical MLP Classification Data?

Karyl PatredisMar 20, 2016
2016-03-20

I read about Alerian’s new Energy MLP Classification Standard (EMCSSM). Do you have historical MLP classification data?

We do! And because we love you, we’ve analyzed it for you. We started by taking “snapshots” of the years 1996, 2002, 2006, 2012, and 2016. The outer orange circles represent the total market cap of the MLP space as of the end of each stated year. The orange rings are divided into pieces that show how much of the total market cap belonged to a certain sector at a given time. In the center of each circle is a solid blue dot that contains the number of MLPs at the end of each year (except for 2016, obvs, which is as of February 29).

We note that the EMCS categorizes MLPs by their primary business activity, so while many MLPs are diversified in their assets, you can only belong to one category.

2016.03.31 Pie Charts

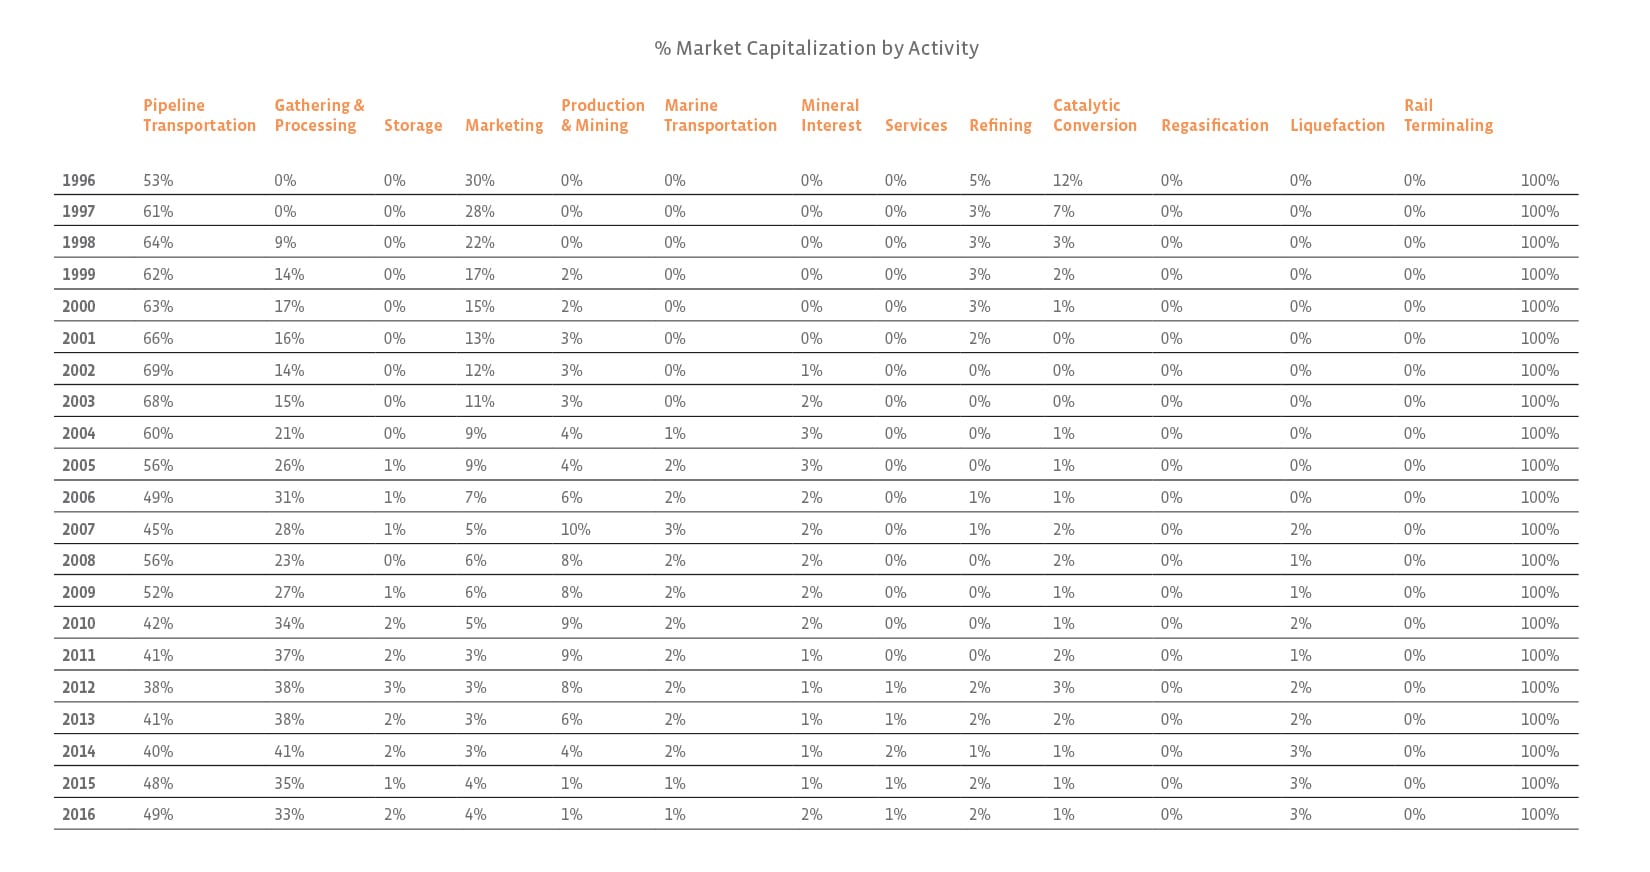
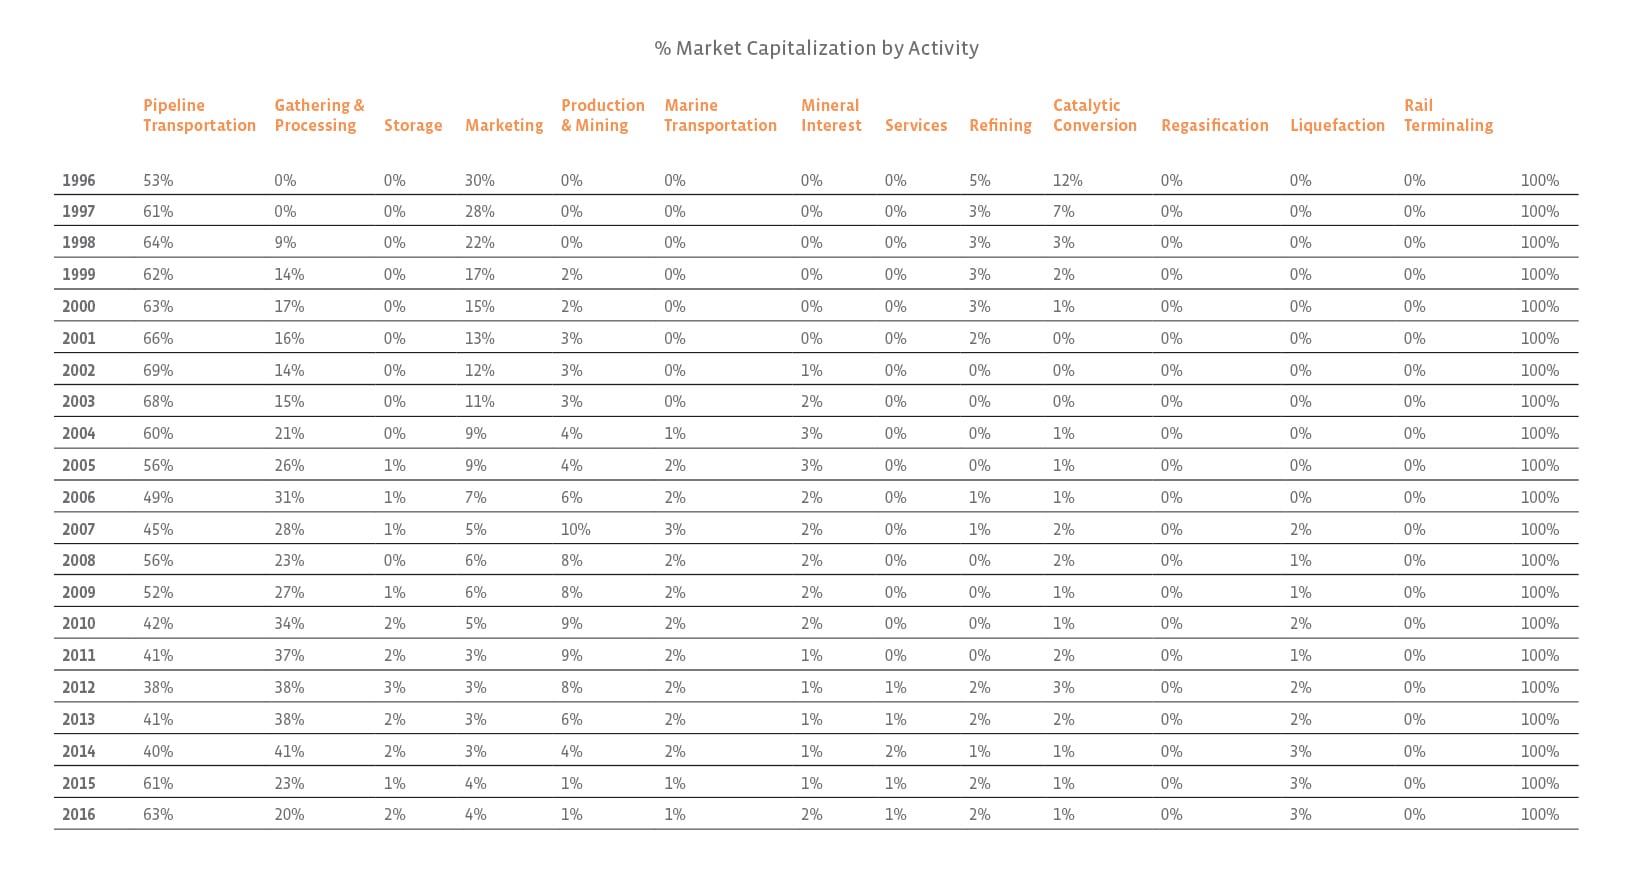
I am a picture person, but for my table people, this may be easier to digest. It also includes the data for all years since 1996!


Content continues below advertisement

2016.03.31 Chart

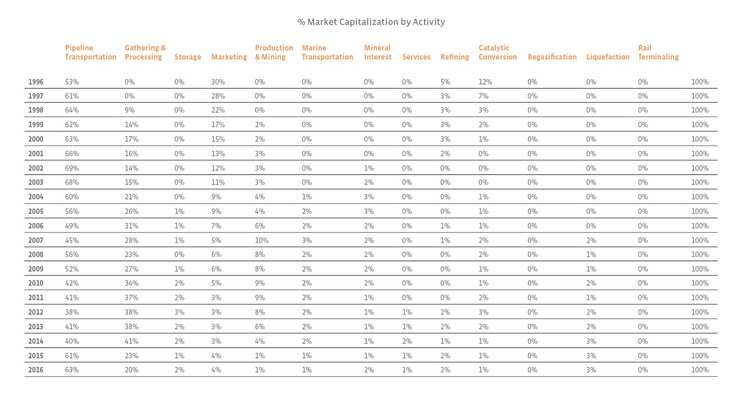
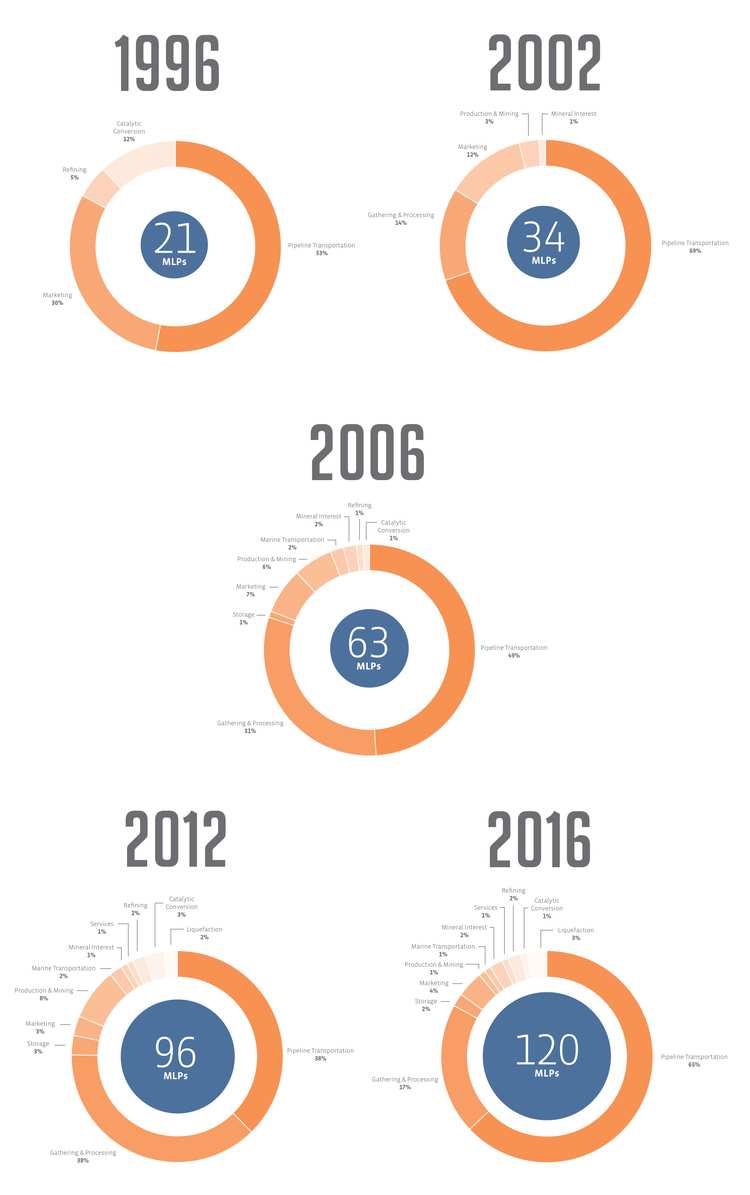
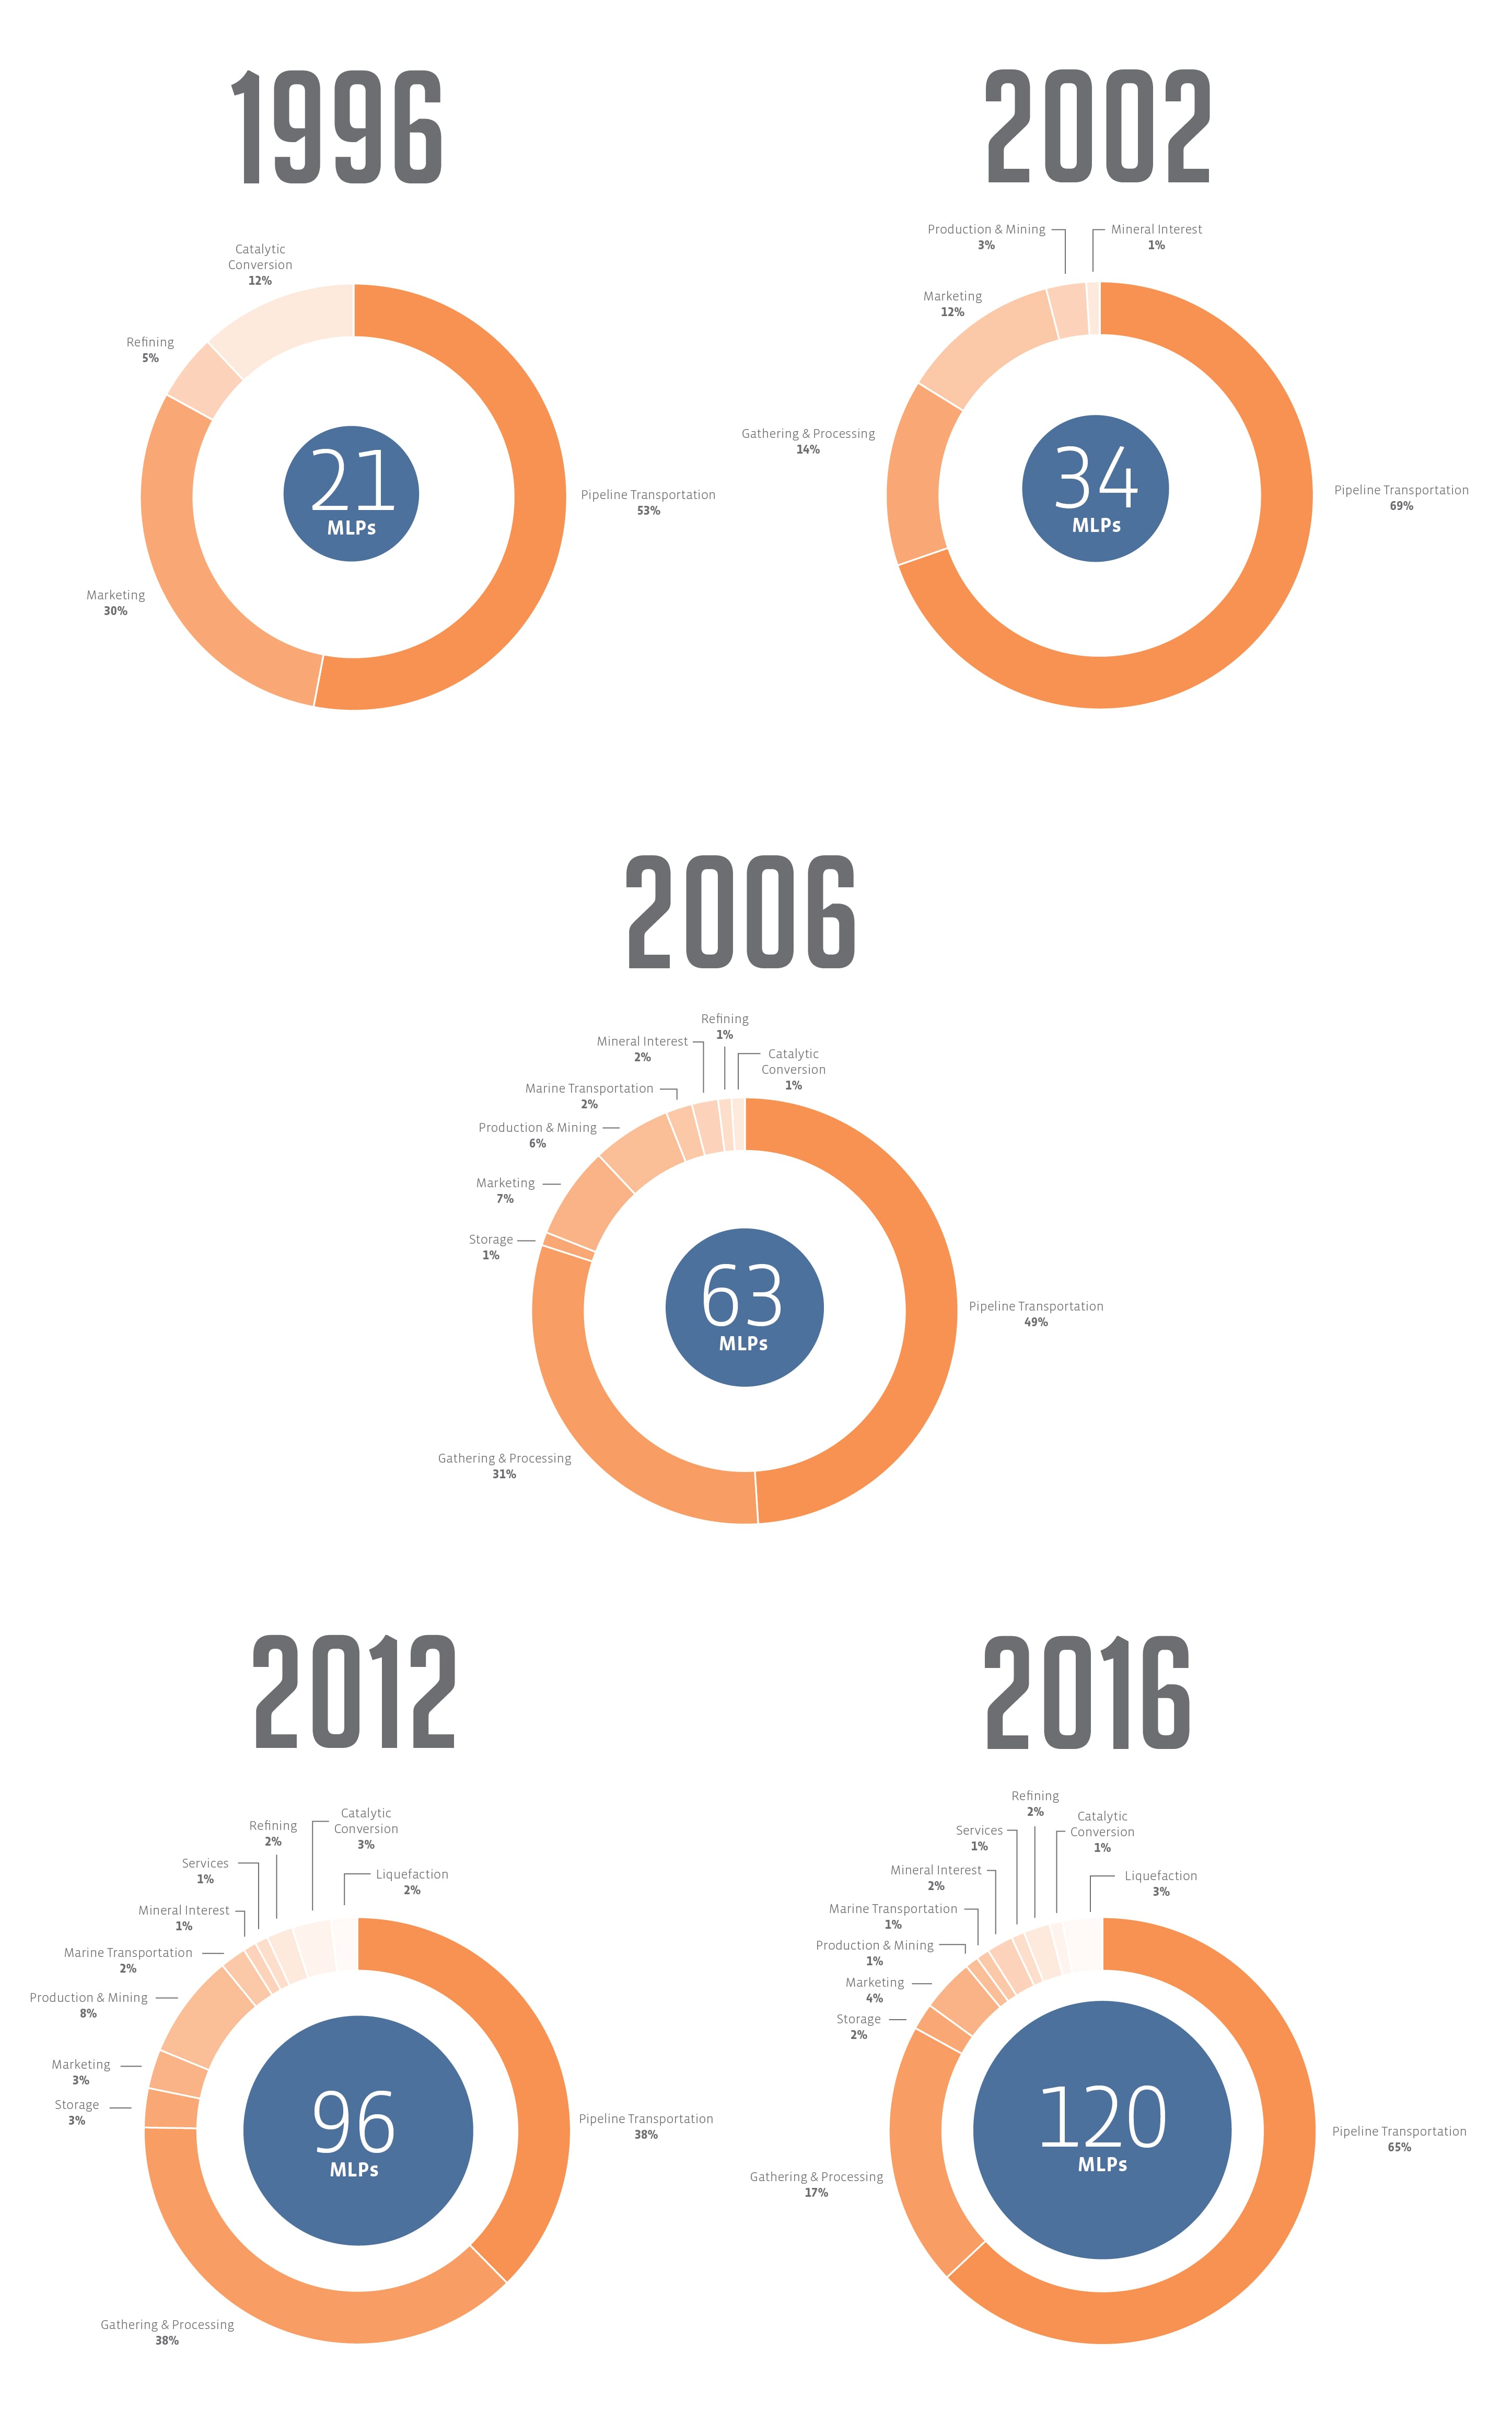
The most obvious takeaway from this data is that the Pipeline Transportation sector has been the primary business in the MLP space for the past 20 years.

However, in the most recent decade, Gathering & Processing MLPs have given Pipeline Transportation MLPs a run for their money. Back in 1998, when there were a whopping 22 MLPs, there was only one G&P company, Enterprise Products Partners (EPD). The company comprised 9% of the total market capitalization. Thanks to the application of horizontal drilling in the Barnett in 2003 and the “shale mania” that followed, the demand for gathering and processing infrastructure (and subsequently, G&P MLPs) began to increase from 2004/2005 and thereafter. By 2006, there were 15 G&P MLPs, and as depicted, 31% of the total market capitalization. In fact, for one year (2014), G&P MLPs (41%) represented a higher percentage versus Pipeline Transportation MLPs (40%) of total energy MLP market capitalization.

On the flip side, the sector that has seen the largest decline in exposure is Marketing. In 1996, six of the 21 MLPs were engaged in propane distribution, representing 30% of total market capitalization. While we’ve seen “gas station MLPs” enter the MLP structure, declining propane demand and significant consolidation in the propane space has resulted in Marketing MLPs representing 4% of total market cap.

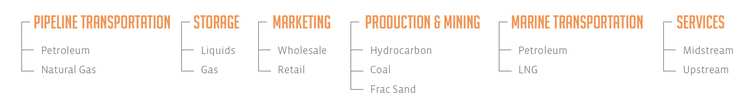
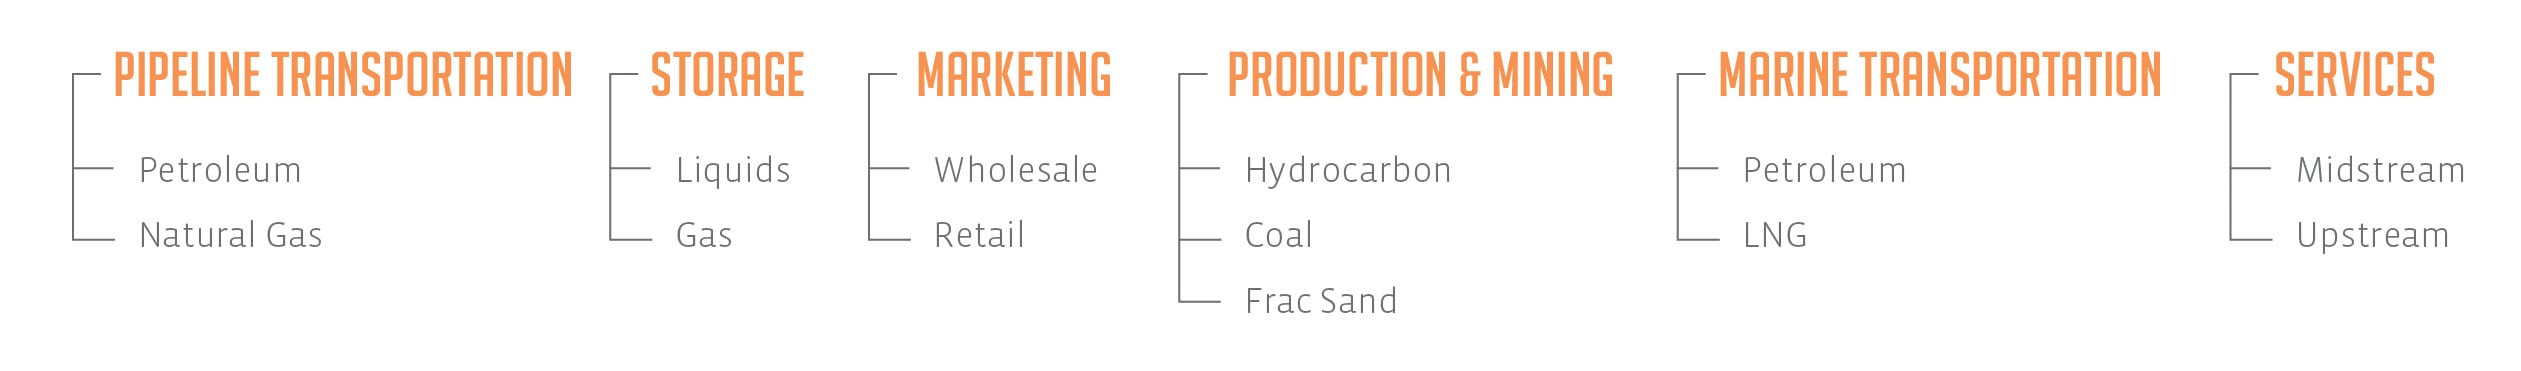
It’s important to note that within several of these categories there are also sub categories:

This is the image alt text

While looking at the pies, it’s clear that Production & Mining MLPs currently make up a relatively small percentage of the total market capitalization. However, at the peak of commodity prices (crude, gas, coal, etc.) in 2007, Production & Mining names reached their highest exposure at 10% (7% to Hydrocarbon and 3% to Coal). Upstream names (Alerian classifies upstream as Production & Mining | Hydrocarbon), which previously made up the bulk of the Production & Mining category, currently only make up 0.4% of total MLP market cap, for obv reasons.

Finally, the sheer number of categories has increased over time from 4 in 1996 to 13 today, as a function of tax lawyers trying to put more businesses into the MLP structure. Just kidding, but not really. With more than 100 PLRs issued in the past two decades, qualifying income continues to be interpreted (and expanded).

To learn which MLPs fit into which category, visit our screener here. To understand which business activities are carried out in each of the sectors, click here to download a helpful PDF. If you have further questions about historical classification data, please email me at index@alerian.com.


Edited to reflect EPD’s classification change to Pipeline Transportation | Natural Gas by the end of 2015. Charts revised on 03.31.2016. 


» Popular Pages

  • Tickers
  • Articles

Sep 29

A Fixed Income Primer for Constructing Portfolios

Sep 29

Main Management Market Note: September 29, 2023

Sep 29

Higher for Much Longer?

Sep 29

Moving Averages: S&P Ends September Down 4.9%

Sep 29

This Week in ETFs: FormulaFolios Renamed & Adds New Funds

Sep 29

Play Online Car Sales News in These 2 China ETFs

Sep 29

SEC Opens Ethereum Futures ETF Floodgates

Sep 29

VettaFi Voices On: Managing Risk in an Uncertain Economy

Sep 29

SPYI Outperforms SPY in Challenging 3rd Quarter

Sep 29

More Rate Hikes? Watch Treasury ETF USFR

QQQ

Invesco QQQ Trust Series I

SPY

SPDR S&P 500 ETF Trust

VOO

Vanguard S&P 500 ETF

JEPI

JPMorgan Equity Premium...

TLT

iShares 20+ Year Treasury...

SCHD

Schwab US Dividend Equity ETF...

SMH

VanEck Semiconductor ETF

VGT

Vanguard Information...

VTI

Vanguard Total Stock Market...

XLK

Technology Select Sector SPDR...

Loading Articles...
Our Sites
  • VettaFi
  • Advisor Perspectives
  • ETF Trends
Tools
  • ETF Screener
  • Mutual Fund to ETF Converter
  • Head-To-Head ETF Comparison
  • ETF Country Exposure Tool
  • ETF Stock Exposure Tool
  • ETF Database Pro
More Tools
  • Financial Advisor & RIA Center
Explore ETFs
  • ETF News
  • ETF Category Reports
  • Premium Articles
  • Alphabetical Listing of ETFs
  • Browse ETFs by ETF Database Category
  • Browse ETFs by Index
  • Browse ETFs by Issuer
  • Compare ETFs
Information
  • Contact Us
  • Terms of Use and Privacy Policy
  • © 2023 VettaFi LLC. All rights reserved.

Advertisement

Is Your Portfolio Positioned With Enough Global Exposure?

ETF Education Channel

How to Allocate Commodities in Portfolios

Tom LydonApr 26, 2022
2022-04-26

A long-running debate in asset allocation circles is how much of a portfolio an investor should...

Core Strategies Channel

Why ETFs Experience Limit Up/Down Protections

Karrie GordonMay 13, 2022
2022-05-13

In a digital age where information moves in milliseconds and millions of participants can transact...

}
X