ETFdb Logo
  • ETF Database
  • Content Hubs
    • Themes
      • Active ETF
      • Alternatives
      • Artificial Intelligence
      • China Insights
      • Core Strategies
      • Crypto
      • Disruptive Technology
      • Energy Infrastructure
      • ETF Building Blocks
      • ETF Investing
      • ETF Strategist
      • Financial Literacy
      • Fixed Income
      • Free Cash Flow
      • Future ETFs
      • Innovative ETFs
      • Institutional Income Strategies
      • Leveraged & Inverse
      • Market Insights
      • Market Outlooks
      • Modern Alpha
      • Nuclear Energy
      • Portfolio Strategies
      • Sector Investing
      • Tax Efficient Income
      • Thematic Investing
    • Asset Class
      • Equity
        • U.S. Equity
        • Int'l Developed
        • Emerging Market Equities
      • Alternatives
        • Gold/Silver/Critical Materials
        • Cryptocurrency
        • Currency
        • Volatility
      • Fixed Income
        • Investment Grade Corporates
        • US Treasuries & TIPS
        • High Yield Corporates
        • Int'l Fixed Income
    • ETF Ecosystem
    • ETFs in Canada
    • Market Outlook
    • Crypto ETF Hub
  • Tools
    • ETF Screener
    • ETF Country Exposure Tool
    • ETF Database Categories
    • Indexes
    • Scenario Analysis
    • Watchlists
    • Head-To-Head ETF Comparison Tool
    • Mutual Fund To ETF Converter
    • ETF Stock Exposure Tool
    • ETF Issuer Fund Flows
  • Research
    • ETF Education
    • Equity Investing
    • Dividend ETFs
    • Leveraged ETFs
    • Inverse ETFs
    • Index Education
    • Index Insights
    • Top ETF Sectors
    • Top ETF Issuers
    • Top ETF Industries
  • Webcasts
  • Sectors
    • Sector Investing Content Hub
    • XLK
    • XLI
    • XLU
    • XLY
    • XLP
    • XLRE
    • Sector Power Rankings
    • XLE
    • XLC
    • XLF
    • XLV
    • XLB
  • Multimedia
    • ETF 360 Video Series
    • ETF of the Week Podcast
    • Gaining Perspective Podcast
    • ETF Prime Podcast
    • Video
  • Company
    • About VettaFi
  • PRO
    • Pro Content
    • Pro Tools
    • Advanced
    • FAQ
    • Free sign up
    • Login
  1. Index Insights
  2. General Partners, Part 2: Why Cash Flows and Distributions Don’t Grow in Lockstep
Index Insights
Share

General Partners, Part 2: Why Cash Flows and Distributions Don’t Grow in Lockstep

Maria HalmoJul 22, 2015
2015-07-22

I hate to bring up tax time in July, but for those of you who filed for an extension, hopefully it’s a reminder not to wait until it’s too late. Hopefully you’re also personally familiar with the idea of higher compensation bumping you up into a higher tax bracket. For 2014, if you made $50,000, you were in the 25% tax bracket. But that doesn’t mean you paid $12,500 (25% of $50,000) to the government—you actually paid $8,356—or 16.7% of your income—because brackets define you by the last dollar you earn. Your marginal tax rate is 25%, but your effective tax rate is 16.7%. Likewise, if you made $100,000 in 2014, you would have a marginal tax rate of 28%, but an effective tax rate of 21.2%. This is called a progressive tax system. The more money you make, the greater the percentage of incremental dollars the government gets. This aligns your incentives with those of the government.

MLPs don’t pay taxes directly to the government, but those MLPs with IDRs follow a very similar bracket system designed to align GP interests with those of LPs. Except with MLPs, the highest bracket—known as a split—isn’t 39.6%; it’s 50%.

In General Partners, Part 1, we examined the rise and fall of the publicly traded GP, with emphasis on why an LP—more commonly known as an MLP—would want to buy out its GP. Just before publication of that piece, Kinder Morgan (KMI) announced the consolidation of its family of companies into the parent, not into the LP. As mentioned with the Kinder Morgan deal and other LP/GP transactions, as the MLP distributes more and more cash, an increasing portion of the incremental cash flow goes to the GP.

Here are two examples to that effect: Targa Resources Partners (NGLS) and Exterran Partners (EXLP). First, their split schedules:

This is the image alt text

And here’s how that’s translated into total distributions paid since their IPOs.


Content continues below advertisement

This is the image alt text

This is the image alt text

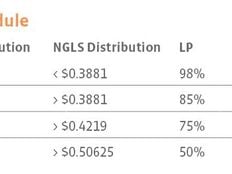
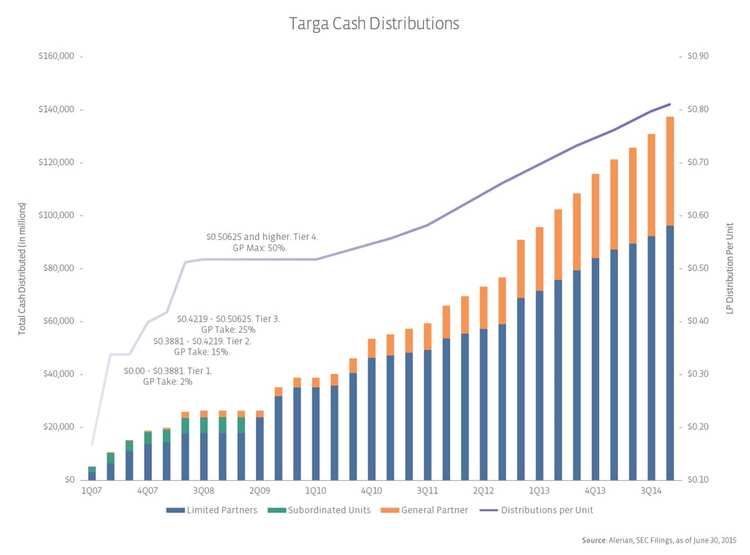
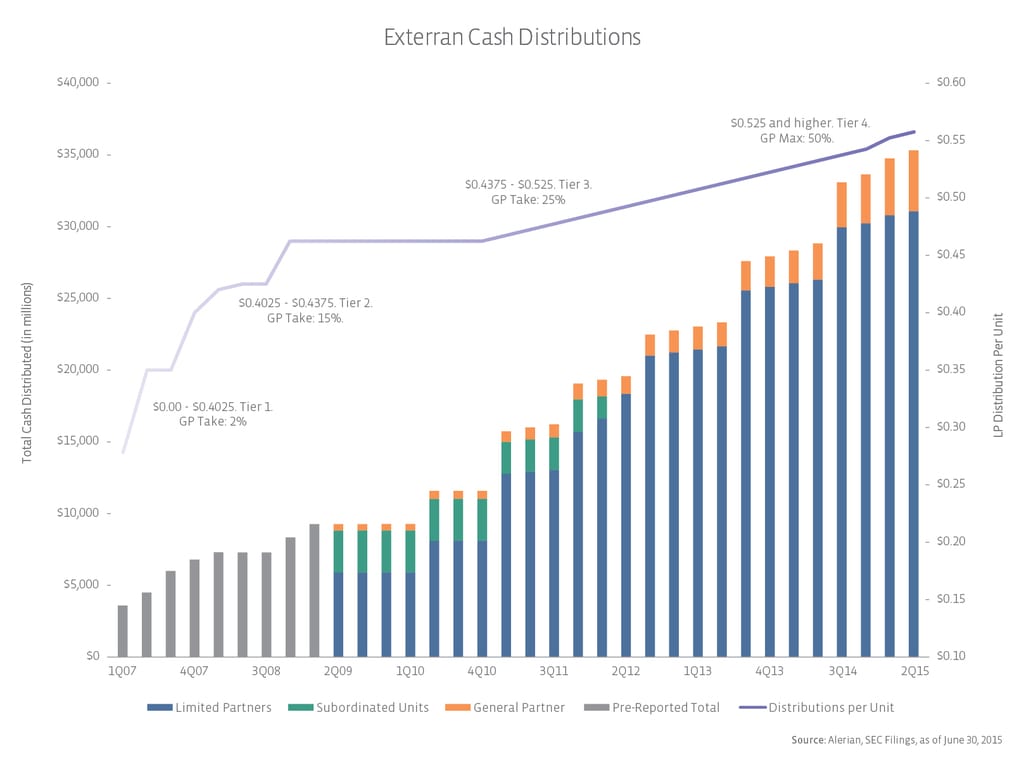
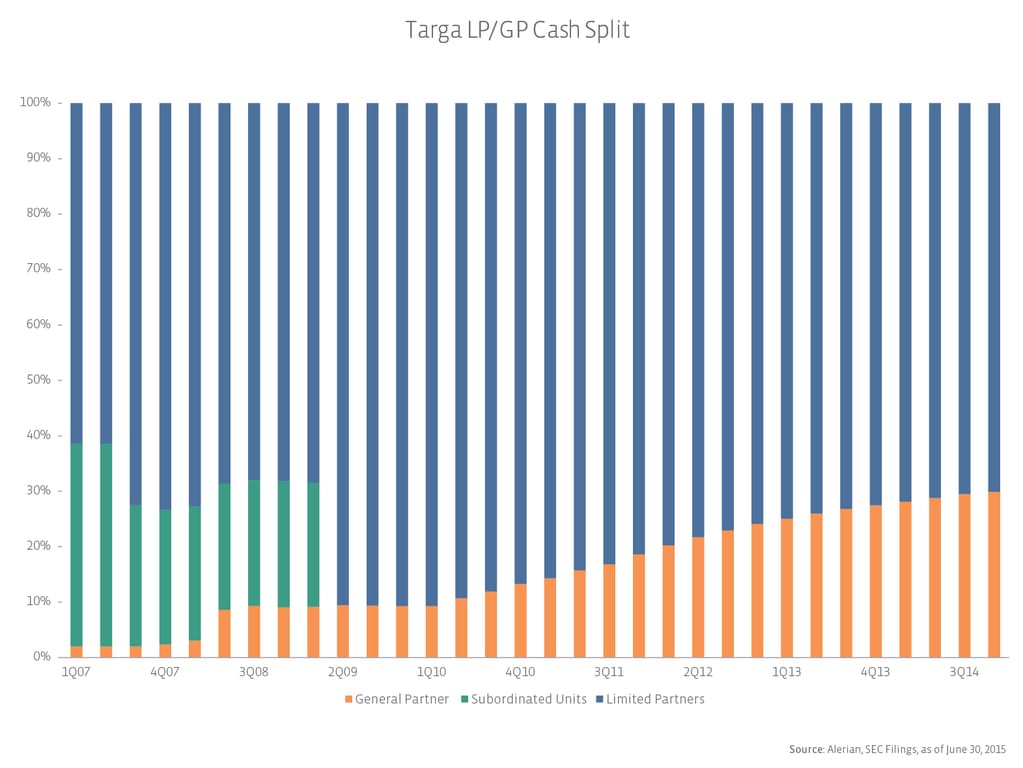
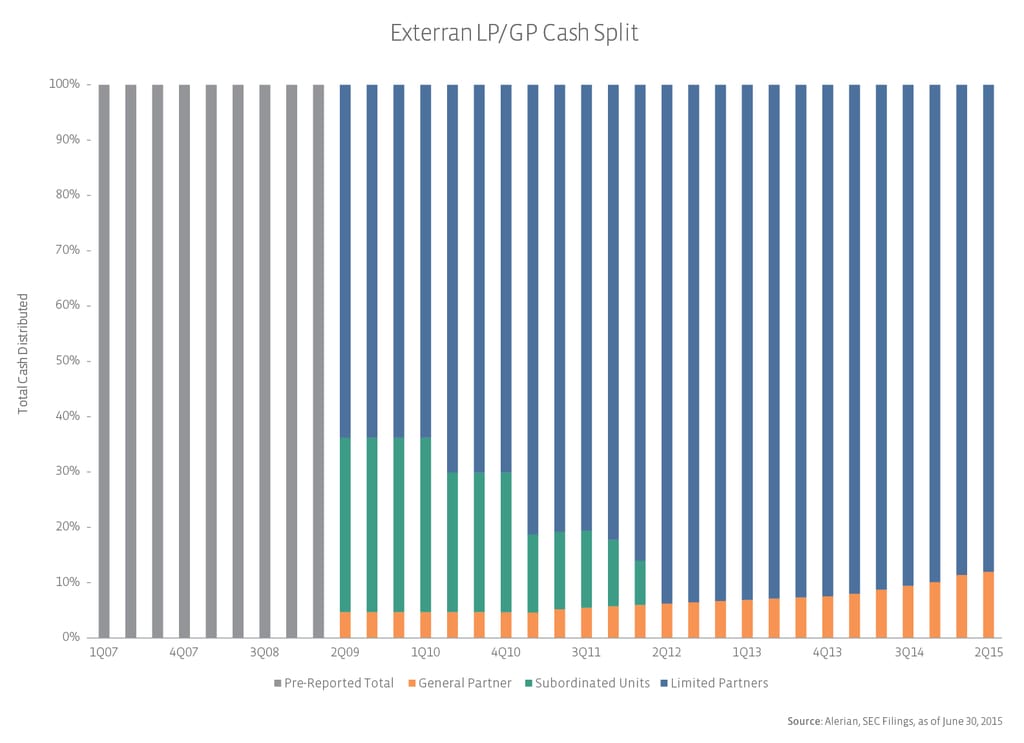
While both companies are in the high splits today, NGLS got there much more quickly. And since NGLS continued to grow its distribution after hitting the 50% splits, the GP’s share of total cash paid out—represented in orange—is much higher at NGLS as compared to EXLP. Here’s the same data in a 100% stacked column chart.

This is the image alt text

This is the image alt text

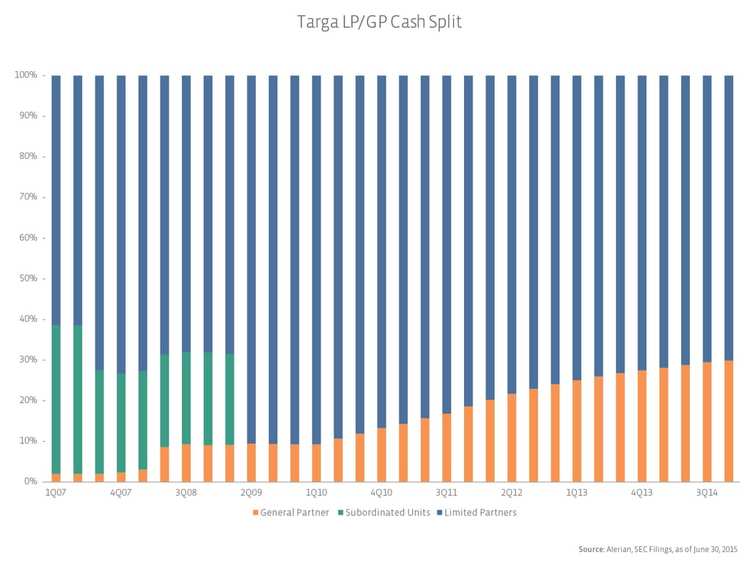
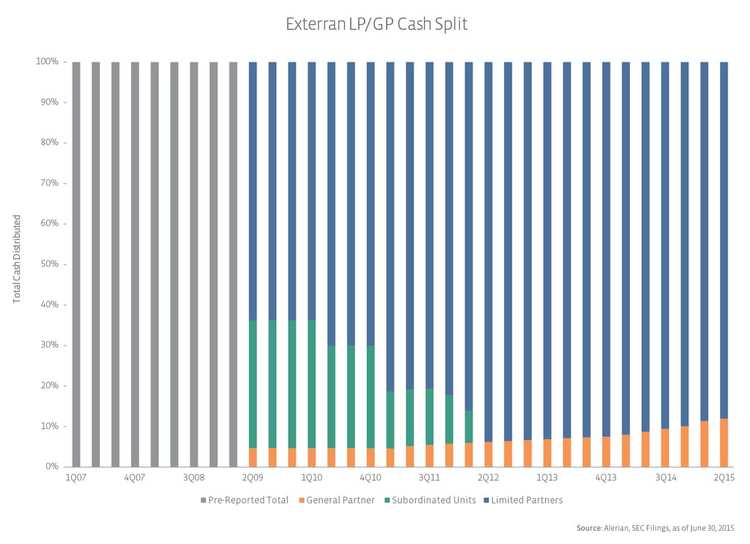
Just like marginal and effective income tax rates, an MLP in the 50% splits does not pay 50% of its total cash flow to the GP. While both partnerships have a “marginal” split of 50%. NGLS and EXLP had 2014 effective splits of 29.1% and 10.0%, respectively.

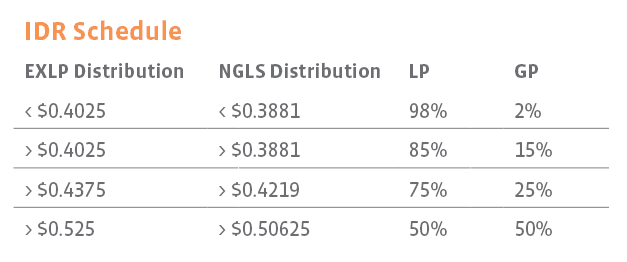
What this all means for an MLP with IDRs is that in order to raise the distribution by 10%, it needs to generate more than 10% in additional distributable cash flow (DCF). The current unitholders have to get paid, the new unitholders from an equity issuance used to fund the organic growth project or acquisition that generates the new DCF have to get paid, and the GP has to get paid—again, up to 50% of incremental cash flows.

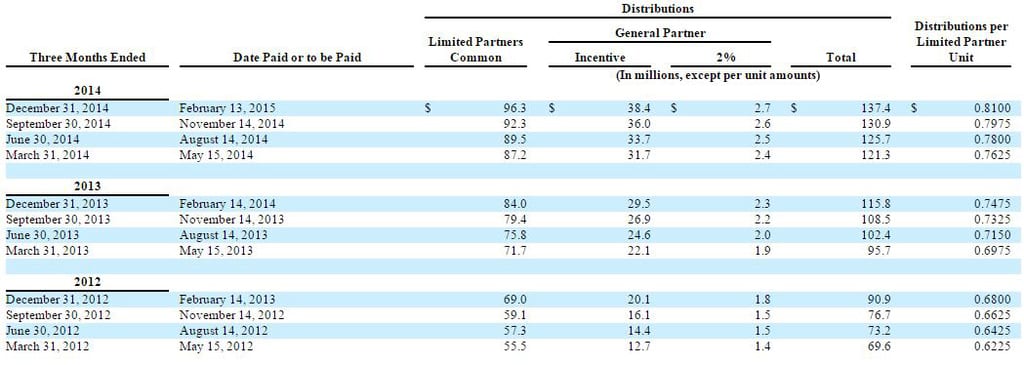
How does this practically play out? Here’s an excerpt from the NGLS 2014 10-K.

This is the image alt text

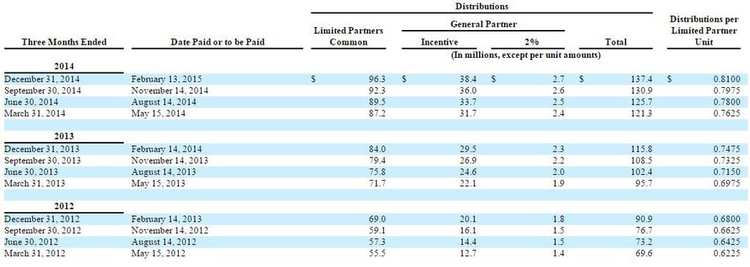
From the fourth quarter of 2013 to the fourth quarter of 2014, NGLS raised its distribution from $0.7475 per unit to $0.81 per unit. As of February 10, 2014, there were 112.4 million LP units outstanding, so the partnership needed $7.0 million of additional cash flow to pay for the $0.0625 of per unit distribution growth. As of February 9, 2015, there were 118.9 LP units outstanding. The unitholders owning those 6.5 million new units issued over the past year also need to be paid their $0.81, so $5.3 million will be needed for that. And the GP, Targa Resources Corp (TRGP), now collects $41.1 million, which is $9.3 million more than the previous year. All together, NGLS raised its distribution 8.4%, but paid out an additional 18.7% of cash.

Knowing the long-term headwind that this incentive structure can create, some MLPs have bought in their GP. But is that necessary? The next installment of this series will focus on how MLPs performed after reaching the high splits.

» Popular Pages

  • Tickers
  • Articles

Jun 23

Benchmarks Are Broken: Why Antiquated Methodologies Fail Fixed Income

Jun 23

How SFLO Finds Quality Companies in Volatile Small-Cap Value Investing

Jun 23

Add Diversification As SMID-Cap ETF TMSL Celebrates Milestone 

Jun 23

India ETFs Worth Examining Following Market’s Rough 2026 Start

Jun 23

Search for Income Should Include International Markets

Jun 23

U.S. Oil Production Outlook & Midstream Implications

Jun 23

Thornburg Expands ETF Suite With New Premium Income Builder Fund

Jun 22

World Markets Watchlist: June 22, 2026

Jun 22

Emerging Markets to Spike as Oil Prices Dip? Try GSEE

Jun 22

Look Beyond Market Euphoria After 3 FCF ETFs Rebalanced

QQQ

Invesco QQQ Trust Series I

VOO

Vanguard S&P 500 ETF

GLD

SPDR Gold Shares

SMH

VanEck Semiconductor ETF

DRAM

Roundhill Memory ETF

SOXX

iShares Semiconductor ETF

PPLT

abrdn Physical Platinum...

SIVR

abrdn Physical Silver Shares...

SCHD

Schwab US Dividend Equity ETF...

SOXL

Direxion Daily Semiconductor...

Loading Articles...

Advertisement

Is Your Portfolio Positioned With Enough Global Exposure?

ETF Education Channel

How to Allocate Commodities in Portfolios

Tom LydonApr 26, 2022
2022-04-26

A long-running debate in asset allocation circles is how much of a portfolio an investor should...

Core Strategies Channel

Why ETFs Experience Limit Up/Down Protections

Karrie GordonMay 13, 2022
2022-05-13

In a digital age where information moves in milliseconds and millions of participants can transact...

}
X