

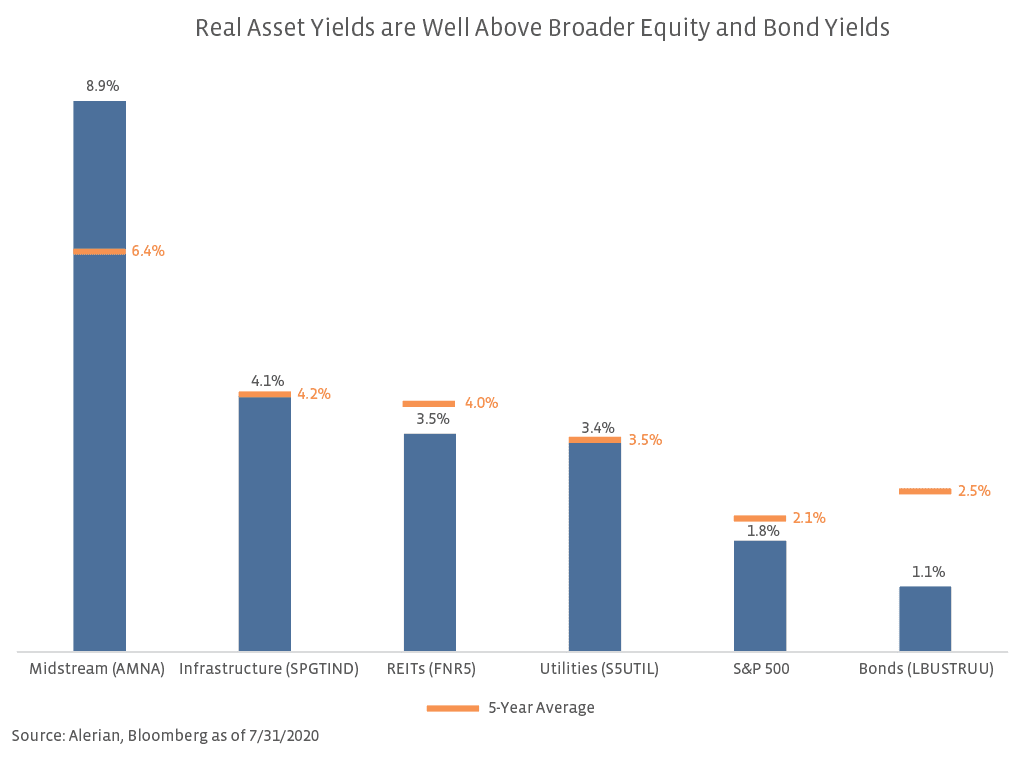
In addition to diversification and potential defensiveness in volatile markets, select real asset investments also offer attractive income. Obviously, directly owning precious metals or commodities doesn’t provide investors with dividend income, but infrastructure companies and REITs, which own income-generating assets, offer above-average yields. The chart below compares the dividend yields for midstream, broader infrastructure, utilities, and REITs to those of the S&P 500 and bonds. The current yield of AMNA is more than 700 basis points above that of the S&P 500 and Barclays US Aggregate Bond Index (LBUSTRUU), respectively. Even utilities, the lowest yielding subsector, offer noticeably higher income than investors can find in the broader market. Current market conditions have left many investors turning elsewhere for income. For these investors, real asset subsectors are positioned to provide high relative income backed by contracted, income-generating assets.

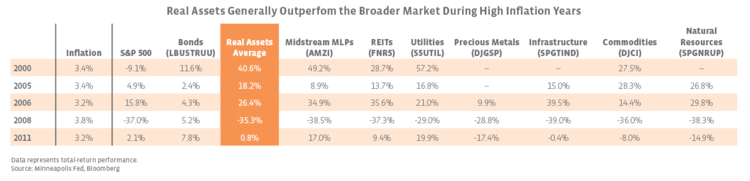
Finally, real assets provide a hedge against inflation and tend to outperform in years when inflation is high. As seen in the table below, real assets on average outperformed the S&P 500 in four of the last five years where the Consumer Price Index (CPI) topped 3%. The S&P 500 Real Assets Index (SPRAUN), which launched at the end of 2005, has outperformed the S&P 500 in every high inflation year since its inception. Idiosyncratic factors impacted each subsector differently, but most sectors consistently outperformed both stocks and bonds in the years analyzed. The CPI has not risen more than 2.4% annually since 2011. Despite the recent easing of monetary policy, the weaker economy will most likely keep inflation in check for now. The Fed is projecting that median inflation will stay below its 2% target through 2022 due to low demand for goods and a weaker correlation between money supply and consumer prices..
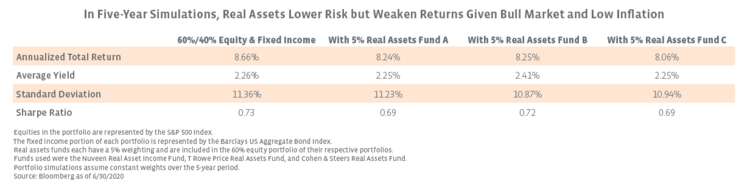
How do these investment considerations work together in a diversified portfolio? The table below shows four simulated five-year, fixed-weight portfolios. The base portfolio has a 60% allocation to the S&P 500 and a 40% allocation to LBUSTRUU only, and the other three include a 5% allocation to one of three real asset funds. While performance and standard deviation vary slightly in each scenario, a 5% allocation to real assets lowered the overall volatility of the portfolio in all three simulations. Yields for each real asset portfolio were either in line with or above the income provided by the general 60/40 portfolio. It is also important to note that the time period analyzed has seen a robust bull market and relatively muted inflation, with the CPI only climbing above 2% in 2017 and 2018. Similar trends were observed on a year-to-date basis despite the market volatility. Each portfolio with real assets has underperformed the base portfolio through the end of July, albeit with a lower standard deviation and slightly higher yield. The real assets benchmark, SPRAUN, has underperformed the S&P 500 by 963 basis points year-to-date.
Energy infrastructure as a real asset allocation
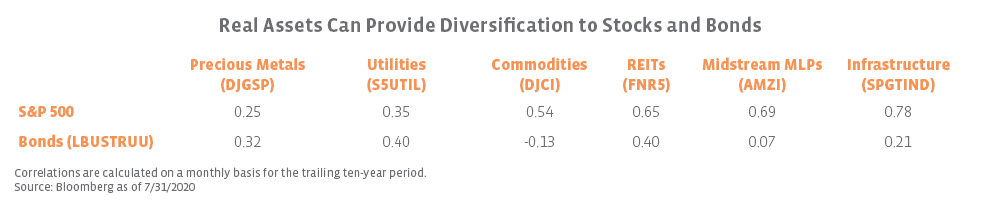
While the overall investment considerations of real assets are similar, how an investor allocates to real assets can result in dramatically different outcomes. As seen in the charts and tables above, correlations, yields, and performance vary from sector to sector. Additionally, different assets are impacted by macroeconomic events in different ways. For example, gold prices have set new all-time highs this year, surging on the back of the Fed’s COVID-19 response, but oil prices have dropped sharply as COVID-19 devastated global oil demand.
With those considerations in mind, why does energy infrastructure stand out among other real asset subsectors? First, as discussed earlier, midstream yields are well above those of both the broader market and its real asset peers. Additionally, provisions built into midstream service contracts provide a hedge against inflation. The fees charged by interstate liquids pipelines are generally subject to the Federal Energy Regulatory Commission’s (FERC) Oil Pipeline Index, which is based on the Producer Price Index for Finished Goods plus an adjustment (read more). While somewhat outdated, data from the Association of Oil Pipe Lines presented in Magellan Midstream Partners’ (MMP) 2018 Analyst Day presentation shows that an estimated 77% of oil pipelines utilize this indexed rate structure. Oil prices, along with other commodities, also tend to perform well during periods of inflation, which could be supportive for midstream sentiment as it likely incentivizes production growth and creates opportunities for midstream.
An investment in energy infrastructure also provides exposure to macro energy dynamics in spite of fee-based, contracted cash flows. Midstream is dependent on global energy demand and production of oil and natural gas in the US and Canada, which strengthens its correlation to oil prices and the broader energy sector when compared to other real assets. For context, the AMZI had a ten-year correlation of 0.47 and 0.82 to WTI crude and the S&P 500 Energy Select Sector Index (IXE), respectively. While this has been a detriment to midstream so far in 2020 due to the headwinds facing the energy sector, investors who are bullish on the long-term prospects for North American energy can get the dual benefit of energy and real asset exposure through midstream. Additionally, with oil prices on more stable footing (read more) and the resilient nature of midstream cash flows (read more), energy infrastructure remains well positioned relative to its energy peers.
Bottom Line
An allocation to real assets, whether done directly or through a liquid financial instrument, can be an important component of a diversified portfolio, particularly one seeking yield and protection from inflation. Investors also looking for energy exposure, higher income, and an added inflation hedge should consider real asset exposure through energy infrastructure.

