ETFdb Logo
ETFdb Logo
  • ETF Database
  • Channels
    • Themes
      • Active ETF
      • Artificial Intelligence
      • Beyond Basic Beta
      • China Insights
      • Climate Insights
      • Core Strategies
      • Crypto
      • Direct Indexing
      • Disruptive Technology
      • Energy Infrastructure
      • ETF Building Blocks
      • ETF Investing
      • ETF Education
      • ETF Strategist
      • Financial Literacy
      • Fixed Income
      • Free Cash Flow
      • Innovative ETFs
      • Institutional Income Strategies
      • Leveraged & Inverse
      • Managed Futures
      • Market Insights
      • Modern Alpha
      • Multifactor
      • Responsible Investing
      • Retirement Income
      • Tax Efficient Income
    • Asset Class
      • Equity
        • U.S. Equity
        • Int'l Developed
        • Emerging Market Equities
      • Alternatives
        • Commodities
        • Gold/Silver/Critical Minerals
        • Currency
        • Volatility
      • Fixed Income
        • Investment Grade Corporates
        • US Treasuries & TIPS
        • High Yield Corporates
        • Int'l Fixed Income
    • ETF Ecosystem
    • ETFs in Canada
  • Tools
    • ETF Screener
    • ETF Country Exposure Tool
    • ETF Sector Tracker Tool
    • ETF Database Categories
    • Head-To-Head ETF Comparison Tool
    • ETF Stock Exposure Tool
    • ETF Issuer Fund Flows
    • Indexes
    • Mutual Fund To ETF Converter
  • Research
    • ETF Education
    • Equity Investing
    • Dividend ETFs
    • Leveraged ETFs
    • Inverse ETFs
    • Index Education
    • Index Insights
    • Top ETF Sectors
    • Top ETF Issuers
    • Top ETF Industries
  • Webcasts
  • Themes
    • AI ETFs
    • Blockchain ETFs
    • See all Thematic Investing ETF themes
    • ESG Investing
    • Marijuana ETFs
  • Multimedia
    • ETF 360 Video Series
    • ETF of the Week Podcast
    • ETF Prime Podcast
    • Video
  • Company
    • About VettaFi
    • Get VettaFi’ed
  • PRO
    • Pro Content
    • Pro Tools
    • Advanced
    • FAQ
    • Pricing
    • Free Sign Up
    • Login
  1. Index Insights
  2. Greatest Hits: Periodic Table of Performance
Index Insights
Share

Greatest Hits: Periodic Table of Performance

Maria HalmoAug 12, 2014
2014-08-12

Periodic Table of Performance


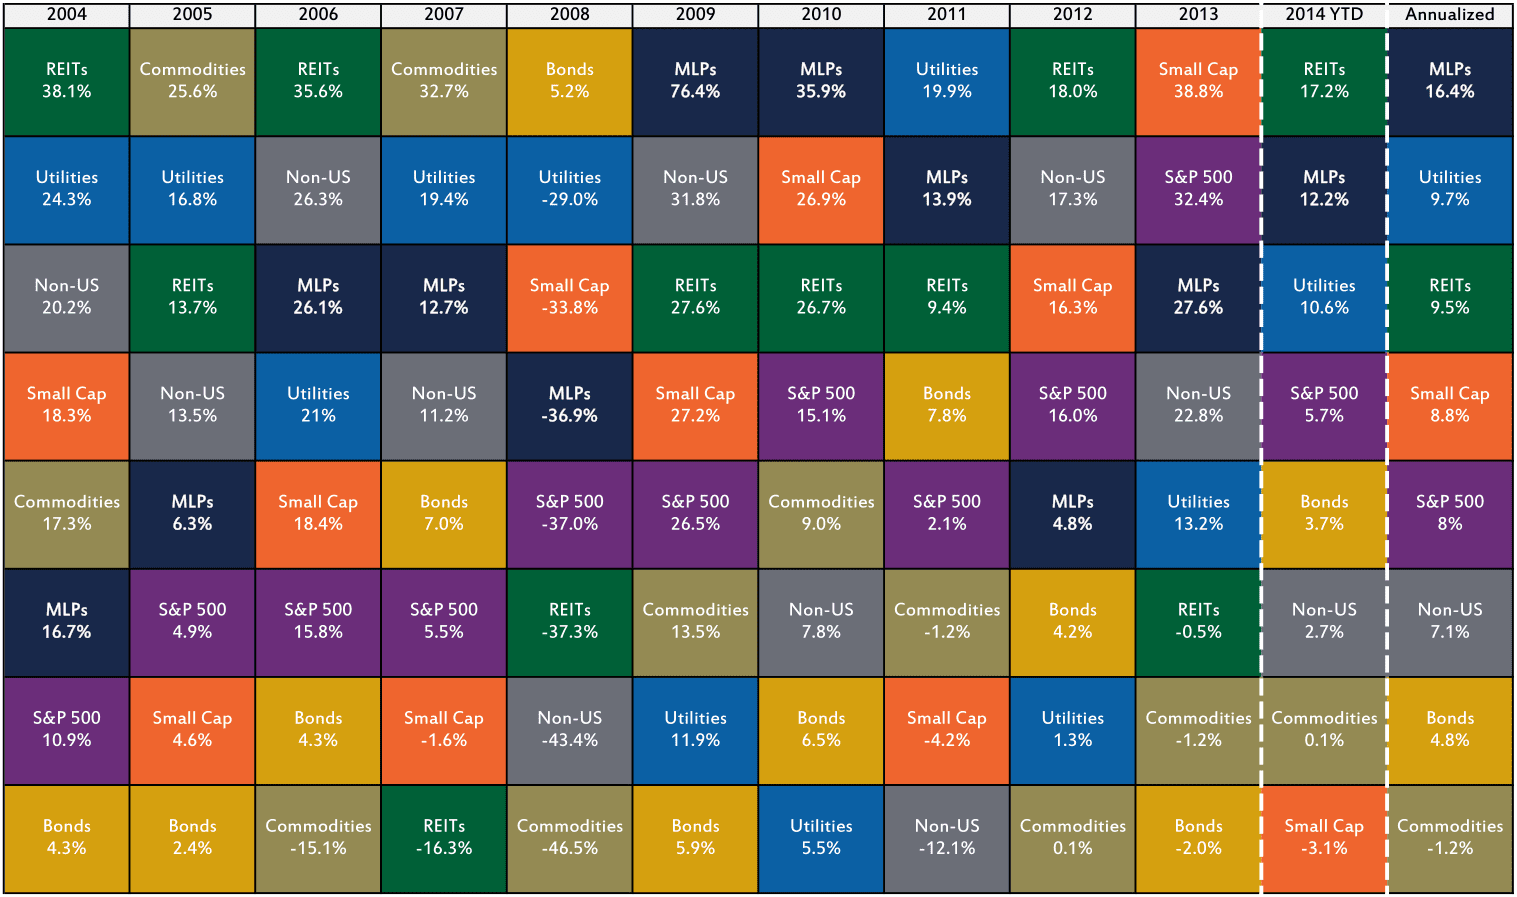
Past performance is no guarantee of future returns, but those who do not learn from history are doomed to repeat it. So many conflicting clichés, but no one has a crystal ball when it comes to investing. That’s one of the reasons diversification is so popular. So in this chart, we’ve presented 10 years of performance of the broader market, yield-oriented equities, and asset classes typically used for diversification.

When looking through this chart, it’s easy to scan and see how asset classes have performed against each other. That’s useful, but it’s easy to overlook the magnitude of their differences. For instance, in 2009, MLPs were up over 70%, more than twice as much as any other asset class. So far in 2014, there’s only a 20% spread between the best and worst performing asset classes.

Looking at the mustard yellow boxes representing bond performance, it’s easy to see why some income-oriented investors are considering replacing some or all of their bond exposure with MLPs. While both asset classes do have higher yields and lower correlations to the broader market, MLPs are equities, not bonds. They are not guaranteed to pay a dividend and may react more strongly to changing market conditions. This was most evident in 2008, when MLPs fell twice as far as bonds.

One smaller point of comparison is between MLPs and commodities. MLPs traditionally operate fee-for-service or toll-road business models that are generally agnostic to moderate changes in commodity prices. However, at some point, if commodity prices rise high enough, demand destruction could reduce volumes and negatively affect MLP cash flows. On the other side, if commodity prices fall far enough, the cost to get them out of the ground could exceed the price at which they can be sold. In this case, producers will shut in (or cease) production, which will also reduce volumes and negatively affect MLP cash flows. Fortunately for MLPs, meaningful swings in commodity prices are self-correcting mechanisms. It is also worth noting that as MLPs have become a better known asset class, and investors associate them with the energy sector in general, correlation to commodities has risen.

When speaking about diversification, MLPs and REITs are often compared to each other. However, comparing statistics from the AMZ factsheet, REITs have more volatility as measured by standard deviation, with less return. When looking at any data, it’s always best to look at the numbers in several different ways, as any one chart will not be able to tell the whole story.

We would be remiss if we didn’t acknowledge that this chart is known by the industry as the “EPD Blinking Slide”, a reference to Enterprise Products Partners’ use of a periodic performance table at its annual March analyst day to highlight the stock’s outperformance over the years. Their table looks similar to the one above, though with different colors and animation for EPD’s box in each column.


Content continues below advertisement

This is the image alt text

Master Limited Partnerships (MLPs) are represented by the Alerian MLP Index (AMZ). Utilities are represented by the S&P 500 Utilities Index. Real Estate Investment Trusts (REITs) are represented by the FTSE NAREIT Real Estate 50 Index. Small-cap equities are represented by the Russell 2000 Index. The S&P 500 is a capitalization-weighted index of 500 stocks designed to measure performance of the broad US economy. Non-US equities are represented by the MSCI EAFE Index. Bonds are represented by the Barclays US Aggregate Total Return Bond Index. Commodities are represented by the S&P World Commodity Index. Performance is provided on a total return basis. Annualized performance represents the period from July 31, 2004 to July 31, 2014. Year-to-date performance is as of July 31, 2014.

» Popular Pages

  • Tickers
  • Articles

Sep 29

A Fixed Income Primer for Constructing Portfolios

Sep 29

Main Management Market Note: September 29, 2023

Sep 29

Higher for Much Longer?

Sep 29

Moving Averages: S&P Ends September Down 4.9%

Sep 29

This Week in ETFs: FormulaFolios Renamed & Adds New Funds

Sep 29

Play Online Car Sales News in These 2 China ETFs

Sep 29

SEC Opens Ethereum Futures ETF Floodgates

Sep 29

VettaFi Voices On: Managing Risk in an Uncertain Economy

Sep 29

SPYI Outperforms SPY in Challenging 3rd Quarter

Sep 29

More Rate Hikes? Watch Treasury ETF USFR

QQQ

Invesco QQQ Trust Series I

SPY

SPDR S&P 500 ETF Trust

VOO

Vanguard S&P 500 ETF

JEPI

JPMorgan Equity Premium...

TLT

iShares 20+ Year Treasury...

SCHD

Schwab US Dividend Equity ETF...

SMH

VanEck Semiconductor ETF

VGT

Vanguard Information...

VTI

Vanguard Total Stock Market...

XLK

Technology Select Sector SPDR...

Loading Articles...
Our Sites
  • VettaFi
  • Advisor Perspectives
  • ETF Trends
Tools
  • ETF Screener
  • Mutual Fund to ETF Converter
  • Head-To-Head ETF Comparison
  • ETF Country Exposure Tool
  • ETF Stock Exposure Tool
  • ETF Database Pro
More Tools
  • Financial Advisor & RIA Center
Explore ETFs
  • ETF News
  • ETF Category Reports
  • Premium Articles
  • Alphabetical Listing of ETFs
  • Browse ETFs by ETF Database Category
  • Browse ETFs by Index
  • Browse ETFs by Issuer
  • Compare ETFs
Information
  • Contact Us
  • Terms of Use and Privacy Policy
  • © 2023 VettaFi LLC. All rights reserved.

Advertisement

Is Your Portfolio Positioned With Enough Global Exposure?

ETF Education Channel

How to Allocate Commodities in Portfolios

Tom LydonApr 26, 2022
2022-04-26

A long-running debate in asset allocation circles is how much of a portfolio an investor should...

Core Strategies Channel

Why ETFs Experience Limit Up/Down Protections

Karrie GordonMay 13, 2022
2022-05-13

In a digital age where information moves in milliseconds and millions of participants can transact...

}
X