ETFdb Logo
  • ETF Database
  • Content Hubs
    • Themes
      • Active ETF
      • Alternatives
      • Artificial Intelligence
      • China Insights
      • Core Strategies
      • Crypto
      • Disruptive Technology
      • Energy Infrastructure
      • ETF Building Blocks
      • ETF Investing
      • ETF Strategist
      • Financial Literacy
      • Fixed Income
      • Free Cash Flow
      • Future ETFs
      • Innovative ETFs
      • Institutional Income Strategies
      • Leveraged & Inverse
      • Market Insights
      • Market Outlooks
      • Modern Alpha
      • Nuclear Energy
      • Portfolio Strategies
      • Sector Investing
      • Tax Efficient Income
      • Thematic Investing
    • Asset Class
      • Equity
        • U.S. Equity
        • Int'l Developed
        • Emerging Market Equities
      • Alternatives
        • Gold/Silver/Critical Materials
        • Cryptocurrency
        • Currency
        • Volatility
      • Fixed Income
        • Investment Grade Corporates
        • US Treasuries & TIPS
        • High Yield Corporates
        • Int'l Fixed Income
    • ETF Ecosystem
    • ETFs in Canada
    • Market Outlook
    • Crypto ETF Hub
  • Tools
    • ETF Screener
    • ETF Country Exposure Tool
    • ETF Database Categories
    • Indexes
    • Scenario Analysis
    • Watchlists
    • Head-To-Head ETF Comparison Tool
    • Mutual Fund To ETF Converter
    • ETF Stock Exposure Tool
    • ETF Issuer Fund Flows
  • Research
    • ETF Education
    • Equity Investing
    • Dividend ETFs
    • Leveraged ETFs
    • Inverse ETFs
    • Index Education
    • Index Insights
    • Top ETF Sectors
    • Top ETF Issuers
    • Top ETF Industries
  • Webcasts
  • Sectors
    • Sector Investing Content Hub
    • XLK
    • XLI
    • XLU
    • XLY
    • XLP
    • XLRE
    • Sector Power Rankings
    • XLE
    • XLC
    • XLF
    • XLV
    • XLB
  • Multimedia
    • ETF 360 Video Series
    • ETF of the Week Podcast
    • Gaining Perspective Podcast
    • ETF Prime Podcast
    • Video
  • Company
    • About VettaFi
  • PRO
    • Pro Content
    • Pro Tools
    • Advanced
    • FAQ
    • Free sign up
    • Login
  1. Index Insights
  2. How Has the Outlook for Midstream Infrastructure Changed Since 2014?
Index Insights
Share

How Has the Outlook for Midstream Infrastructure Changed Since 2014?

Karyl PatredisApr 17, 2016
2016-04-17

How has the outlook for midstream infrastructure changed since 2014?

The Dallas Stars are in the playoffs. These are wildly exciting times around our house as my husband is a huge Stars fan. As Jon begins to cut up confetti to throw when the team wins the Stanley Cup, I try to keep my expectations a bit more grounded.

Just last week, the Interstate Natural Gas Association of America (INGAA) released an updated study discussing midstream oil and gas infrastructure needs in the US and Canada. (Over the years, this has become THE study that everyone in MLP land quotes. Needless to say, we’ve been patiently waiting for the update.) The last study covering this topic was published in March of 2014 when the world was different. Not surprisingly, the predictions have been restated a bit in the 2016 publication. Throughout the study, the authors use high case (optimistic) and low case (less optimistic) scenarios to calculate their estimates. If you’re like Jon, you’ll plan for the high case, but if you’re like me, you’ll prepare for the low case and be pleasantly surprised if you’re wrong.

For starters, here is a handy chart plucked from the pages of the study that explains what would have to happen for the high case to occur vs the low case on a macroeconomic level.

This is the image alt text

Now let’s look to see how the predictions have changed since 2014.


Content continues below advertisement

Total Capital Expenditures Pie Charts-01 (2)

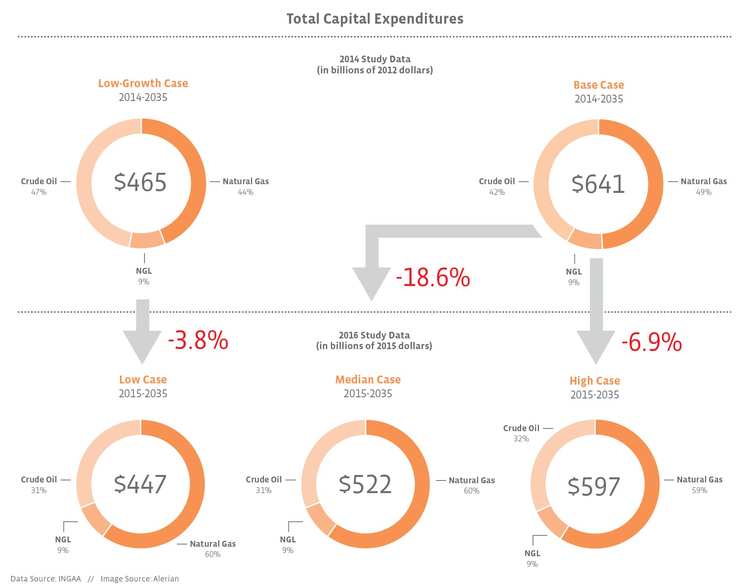
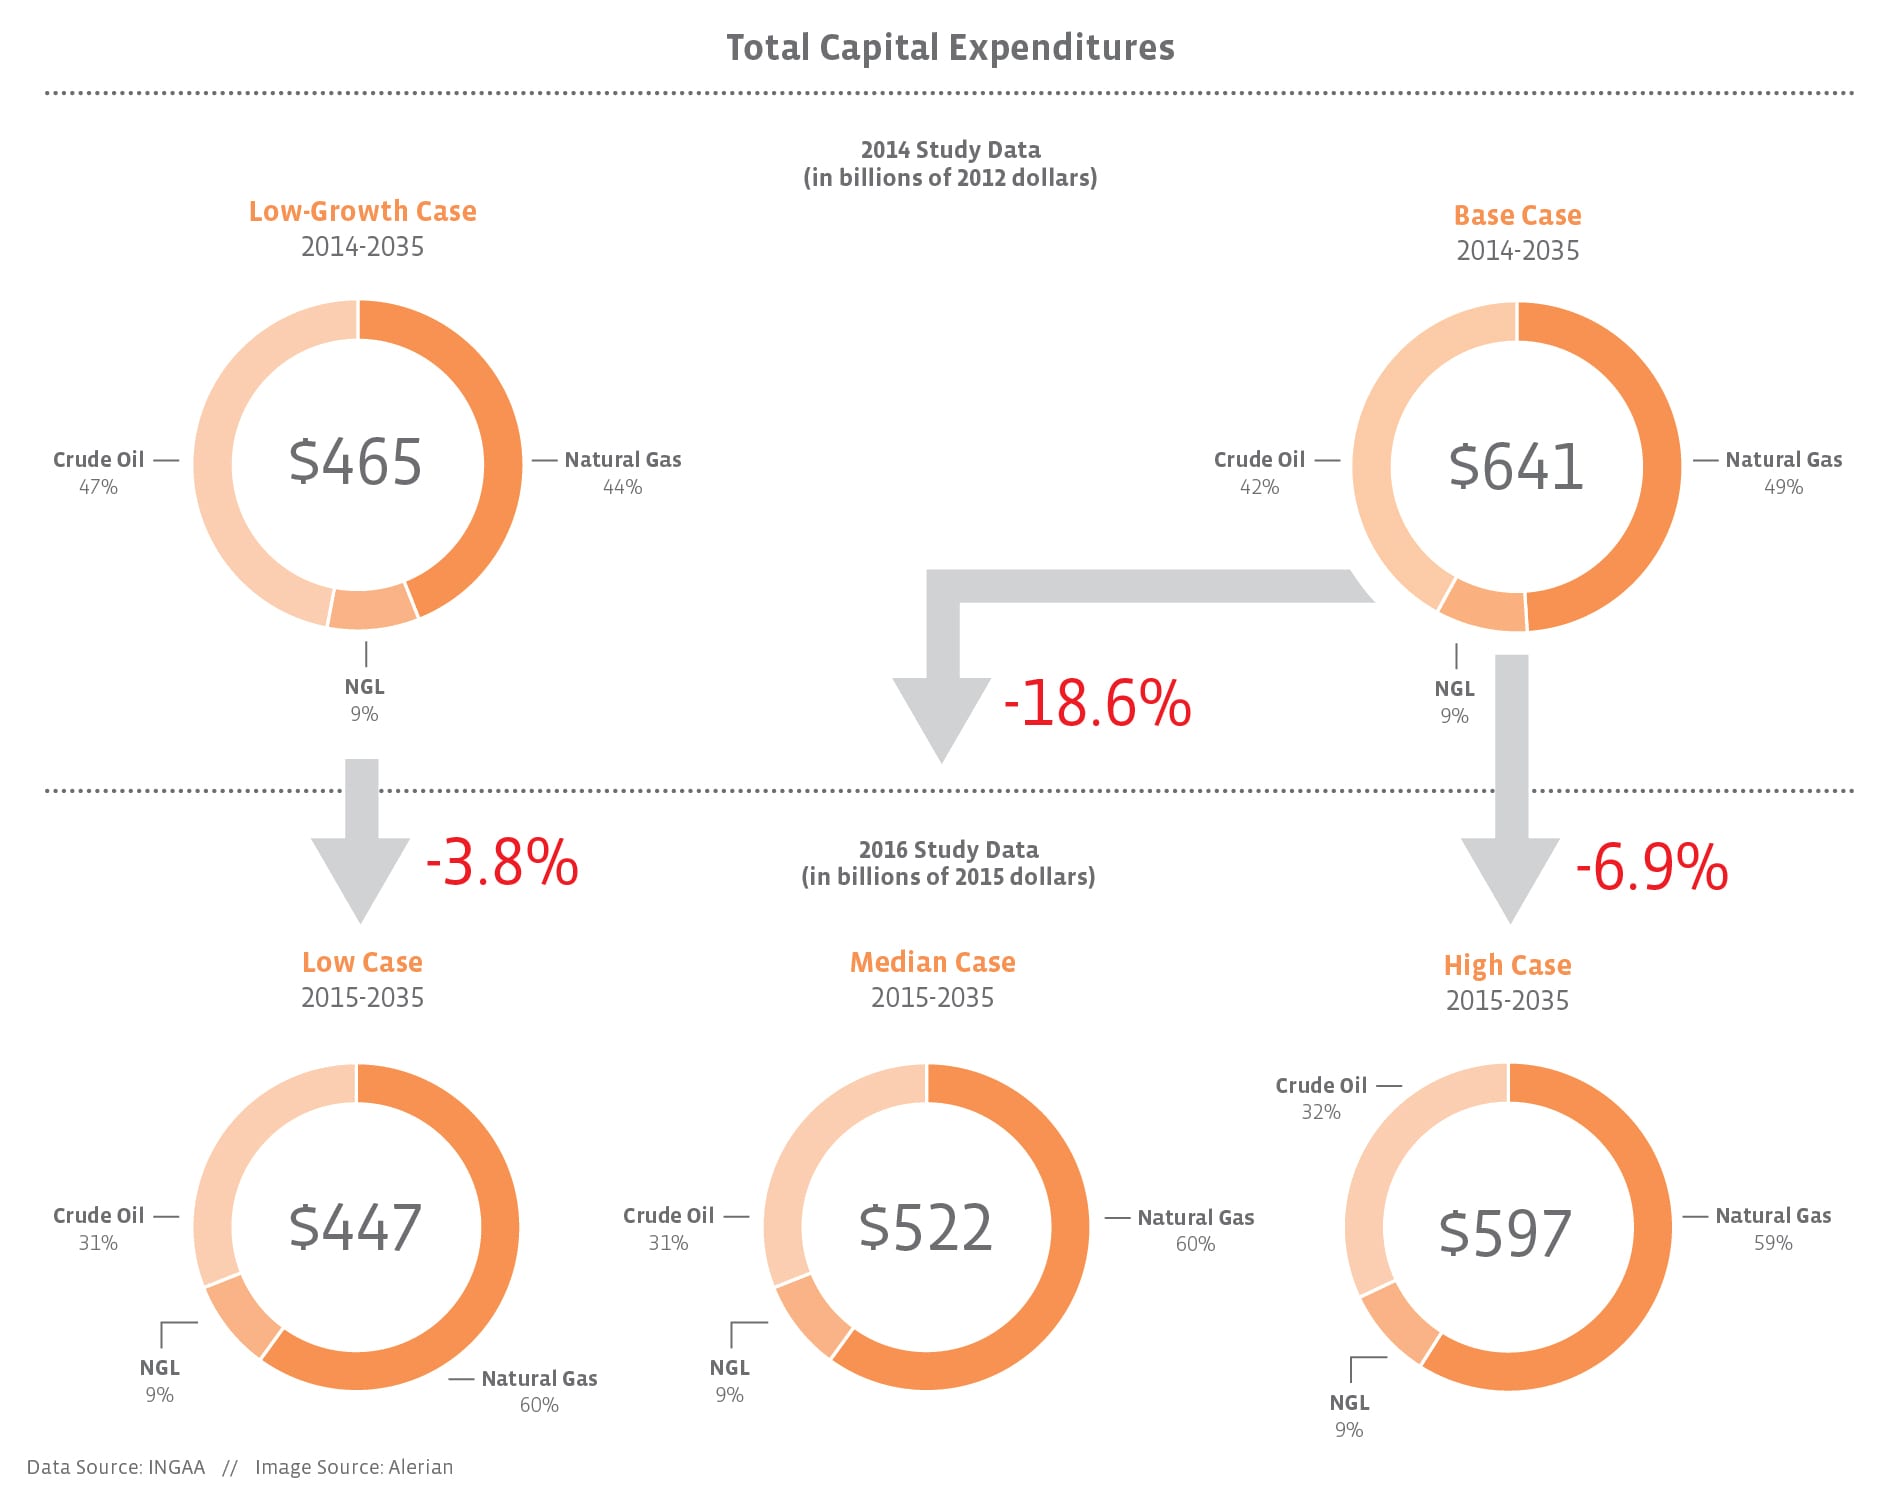
A direct comparison from 2014 to 2016 is a bit tricky because the authors decided against a base case this year due to the uncertainty of the current environment. So, in an effort to provide better evaluation metrics, we’ve included a median case. No matter how you slice it, the projections for new midstream infrastructure needed in the US and Canada have dropped.

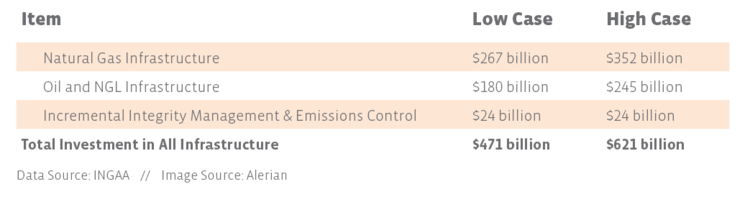
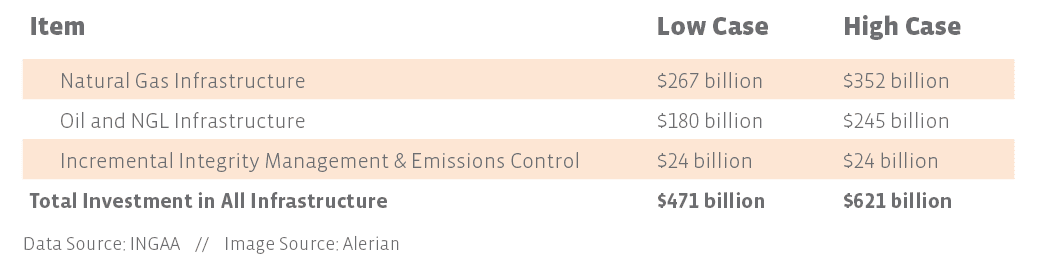
It’s worth mentioning, however, that in their final estimates, the authors of the study included $24 billion (in both the low and high cases) for integrity management. In the past, capital expenses associated with routine replacement and refurbishment of pipelines were already included in cost estimates, but recently released emissions standards have come with an eye-popping implementation price tag and added a new line item to pipeline expenditures. The new National Ambient Air Quality Standards that would require things like hydrostatic testing, in-line inspection, and valve testing are still in litigation, but are items the experts believe may be imminent for pipelines of the future. This undoubtedly has a significant impact, as adding this expense back to the 2016 figures provided in the chart above brings the numbers a bit closer to 2014 estimates. Please check out the table below to see the impact of including the new integrity management expenses.

This is the image alt text

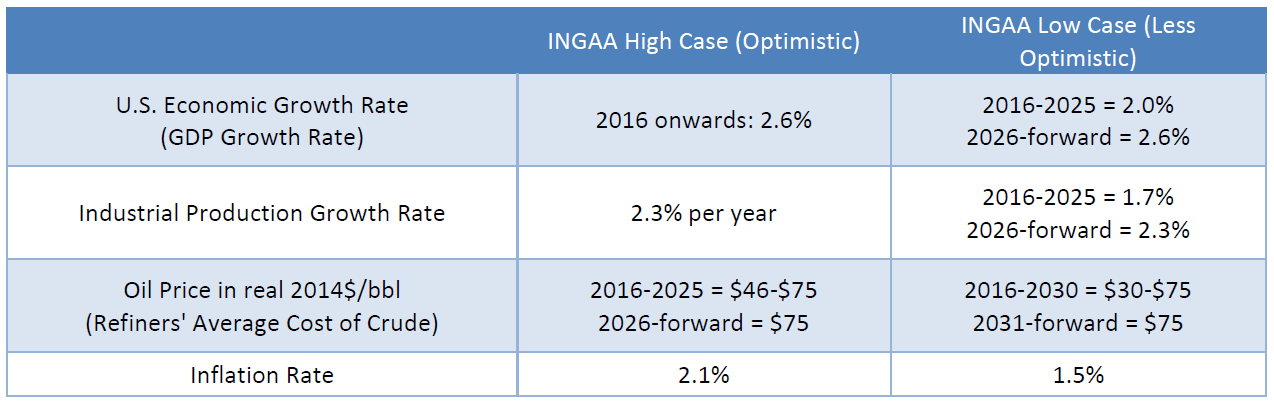
If you’ve read any of our previous blog posts, or read anything about energy over the past year, you’re probably pretty clear on why predictions have decreased. In addition to having a supply glut in the US, world oil supply has also increased. The lifting of sanctions on Iran and globally weakened demand have resulted in the perfect storm. The study also notes improved energy efficiency and renewable energy as potential factors that could impact demand. Given all of this, it’s difficult to predict if/when a recovery will happen and on what scale.

The study clearly incorporates one trend we’ve already discussed, which is natural gas coming to the forefront. If you look closely at the pie charts above, you’ll notice that a significant portion of predicted capex for new midstream infrastructure has shifted from crude oil to natural gas. Crude oil production growth (and the associated need for infrastructure) is predicted to slow because of the oil prices assumed. On the other hand, shale gas production has remained strong resulting in a predicted need for natural gas infrastructure.

Total Capital Expenditures Pie Charts-02 (1)

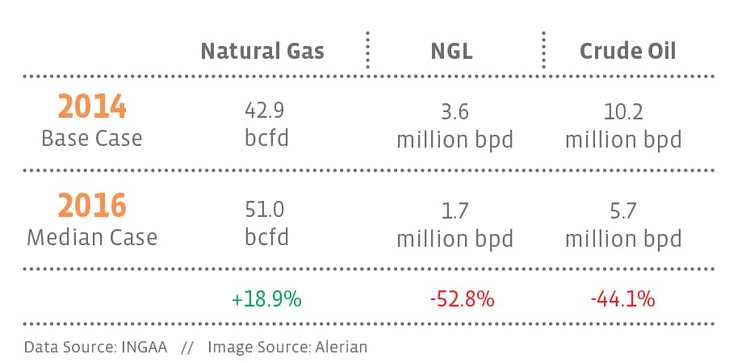
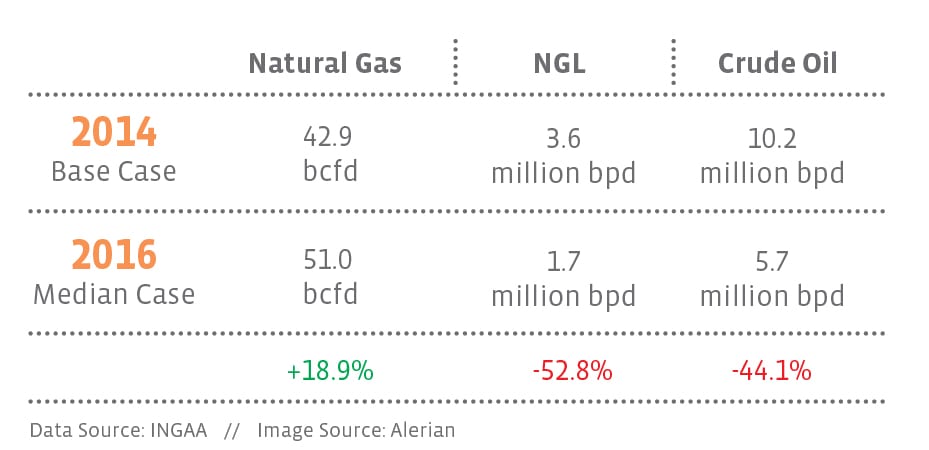
Just in case bcfd and millions of barrels per day are hard for you to imagine, the study tells us that in the high case, 329,000 miles of natural gas, NGL, and crude oil pipelines would be needed. The moon is 230,100 miles away. So if you can imagine pipelines to the moon and almost halfway back, it puts things in perspective.

If you’re interested in learning more about this topic, I highly encourage you to read the INGAA study. I’ve barely scratched the surface of all the information it contains, and it is actually very reader friendly. It’s clear from the study that the energy arena is more uncertain than perhaps it’s ever been. However, in considering the methodologies used to arrive at these numbers, it’s safe to say that traditional energy as we know it still has its place over the next 20 years. Even if you’re like me and feel more comfortable taking the low bet, $447 billion of infrastructure is still needed and that is nothing to shake a hockey stick at. Go Stars.


Edited to reword footnote regarding MLP market cap growth. 

» Popular Pages

  • Tickers
  • Articles

Jun 24

New Home Sales Drop 7% in May

Jun 24

Are Investors Sleeping on Bitcoin Funds in 2026?

Jun 24

Repositioning the Fed

Jun 24

Small Cap Quality Over Size: Why ALPS OUSM Deserves a Look

Jun 24

The Psychology of FOMO in Markets

Jun 24

Building on Mutual Fund Success: Natixis Loomis Sayles Debuts 2 ETFs

Jun 24

Rosenbluth Discusses Thematics & RAFI Acquisition on Schwab Network

Jun 24

Why Advisors Are Ditching Mutual Funds for Sector ETFs

Jun 24

Considering Large-Cap Value? Here’s How BKDV Stands Out

Jun 24

New China Restrictions Showcase REXC's Ex-China Opportunities

QQQ

Invesco QQQ Trust Series I

VOO

Vanguard S&P 500 ETF

SMH

VanEck Semiconductor ETF

GLD

SPDR Gold Shares

DRAM

Roundhill Memory ETF

PPLT

abrdn Physical Platinum...

SIVR

abrdn Physical Silver Shares...

SOXX

iShares Semiconductor ETF

SCHD

Schwab US Dividend Equity ETF...

SOXL

Direxion Daily Semiconductor...

Loading Articles...

Advertisement

Is Your Portfolio Positioned With Enough Global Exposure?

ETF Education Channel

How to Allocate Commodities in Portfolios

Tom LydonApr 26, 2022
2022-04-26

A long-running debate in asset allocation circles is how much of a portfolio an investor should...

Core Strategies Channel

Why ETFs Experience Limit Up/Down Protections

Karrie GordonMay 13, 2022
2022-05-13

In a digital age where information moves in milliseconds and millions of participants can transact...

}
X