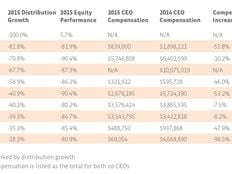
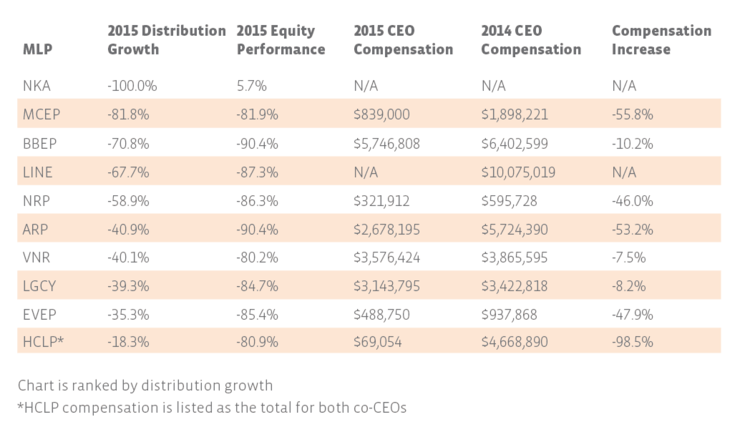
NKA – the underdog surprise
Of the ten MLPs which cut their distributions the most in 2015, only one is a midstream name. That exception, Niska Gas Storage Partners (NKA), is a natural gas storage company, but remarkable in other ways as well. It is the only MLP still standing that paid a distribution in all four quarters of 2014, but did not pay a cent in 2015. Most fascinatingly, it’s one of only a handful of MLPs with a positive equity return for 2015. Unfortunately, NKA’s executive compensation is hard to compare for calendar year 2014 versus calendar year 2015 as (a) 2015 in their filings refers to the period from April 1, 2014 to March 31, 2015, and (b) Simon Dupéré stepped down as CEO in May 2015 and was replaced by Bill Shea. Even then, NKA is technically still standing, but in mid-2015, it agreed to be acquired by Brookfield Infrastructure Partners (BIP).
HCLP – CEOs who get paid like investors
That leaves seven hydrocarbon production companies, one mineral interest company, and one frac sand mining company. Besides being one of two frac sand mining companies, Hi-Crush Partners (HCLP) is unusual for two reasons: (1) it chose to pay a traditional MLP distribution instead of a variable distribution, and (2) it is run by co-CEOs. Since frac sand is used in fracking wells, which is directly related to E&P, some have argued that HCLP should have always been a variable distribution MLP given its exposure to the macro environment, but regardless, their compensation structure is quite interesting. Both co-CEOs and the COO receive a base salary of $1 per year, taking a page out of Rich Kinder’s book. Short-term bonuses could only be earned if the partnership achieved EBITDA, distribution growth, and total return goals, which it did not. Long-term incentives at HCLP are earned by outperforming peers in the Alerian MLP Index (AMZ), which it did not. For their troubles, the co-CEOs at HCLP earned only their $1 salary, plus healthcare benefits and matching 401(k) contributions. That is admittedly harsh, but not only did HCLP cut distributions, unit prices are down over 80%. However, presumably next year they will have the opportunity to earn bonuses and incentives equally as large (or larger!) than those in 2014, if the year turns around.
NRP – the part-time CEO
The mineral interest company, Natural Resource Partners (NRP), also stands out since its CEO, Corbin Robertson, spends about 50% of his time on the MLP, he is only eligible for unit-based awards. This potentially explains why he is one of the lowest compensated CEOs listed.
BBEP – the big spender (in number of units, that is)
Hal Washburn, CEO of Breitburn Energy Partners (BBEP), on the other hand, is the highest compensated CEO of the list, even making more than many of the CEOs examined last week. Washburn’s compensation includes four parts: salary, short-term cash bonus, stock awards, and other (read: standard benefits but also perks). While his salary increased by 1% to $676,000 in 2015, the bulk of his compensation is stock awards, which are set at 6x base salary, regardless of performance. Short-term cash bonus represents the performance-based portion of compensation, which increased in 2015 by more than 20% (from $329,550 to $399,263). According to the filing, 2015 bonuses for all executives were based on (1) integration of the purchase of QRE (2) increased production levels, (3) decreasing opex expenses, (4) closing another acquisition, and (5) negotiated bank credit facility. The compensation committee determined that BBEP had met or exceeded these goals; however, BBEP did not meet the several strategic goals set by the board at the beginning of the year, which included maintaining distributions, leverage, and a maximum level of bank debt. In consideration of the macro environment, bonuses were scaled to be 79% of the target.
Compensation in 2016 may be different for BBEP compensation, though. It hired a new compensation consultant to take into account declining commodity prices, the decline in BBEP’s unit price, and to continue to align executive and unitholder interest. Long term incentives have been cut 30%, but a new bonus system (separate from the short-term cash bonuses mentioned above), is in place that is discretionary, 50% of which will vest in June, and 50% in December. Additionally, in 2015, guidelines were adopted to insist on executives holding a minimum amount of BBEP equity by 2020. For Washburn, that amount is 5x his annual base salary, or roughly $3.4 million in units using his 2015 salary.
VNR – where investors get the biggest say
According to his employment agreement, the cash incentives for Vanguard Natural Resources (VNR) CEO Scott Smith are measured by 25% each: distribution growth, EBITDA growth, unit performance relative to peer group, and board discretion. His base salary of $550,000 is a minimum, but may be increased by the board. Smith received substantially the same compensation in 2015 as 2014 per the amended 10-k filing. The board paid his target discretionary bonus ($137,000) in each year. It’s not standard, but VNR unitholders vote on executive compensation once every three years, and the next available opportunity will be at the 2017 annual meeting.
For 2016, Smith got a raise and his salary is now $600,000. Additionally, the cash incentive metrics have been changed to (1) adjusted EBITDA, (2) production, (3) lease opex, and (4) G&A expenses. He is also eligible for equity compensation of 5.5x his salary intended to reward him for his “service to Vanguard”.
LINE – the secretive poster child
The poster child of MLP E&P companies, LINN Energy (LINE), has not yet filed its proxy statement, where the executive compensation data is normally found. According to the 10-k, this will be filed for the annual meeting of shareholders—which has not yet been scheduled to our knowledge. In previous years, the proxy statement has been filed in early March. Of the data currently available, in 2014, CEO Mark Ellis made over $10 million, of which 75% is in the form of units as a long-term incentive. (Quite similar, actually, to Washburn of BBEP and Smith of VNR.)
What Is Fair?
In the American economy, we attempt to balance paying people fairly for the work they do, and allowing market forces to work. Aligning the interests of workers with the interests of the company (and the interests of the company with the interests of the workers) is generally seen as a good choice. In the case of MLP CEOs of E&P companies, is it fair that all these companies are highly dependent on commodity prices to do well? When times are hard, the company depends on the CEO to get through that environment—even if it means making a tough choice to cut the distribution. The company (and the CEO’s compensation) may suffer from lower commodity prices, despite neither being a result of individual or company-wide performance. On the flip side, the company (and the CEO, and investors) should then also benefit when commodity prices rise. Which is yet another reason MLPs investors frequently play the long game.
2016.04.21 3:00pm CST – Edited to remove an incorrect reference to NRP’s market capitalization.

