
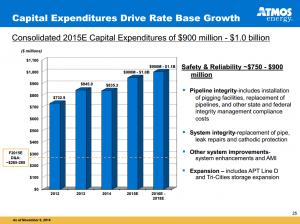

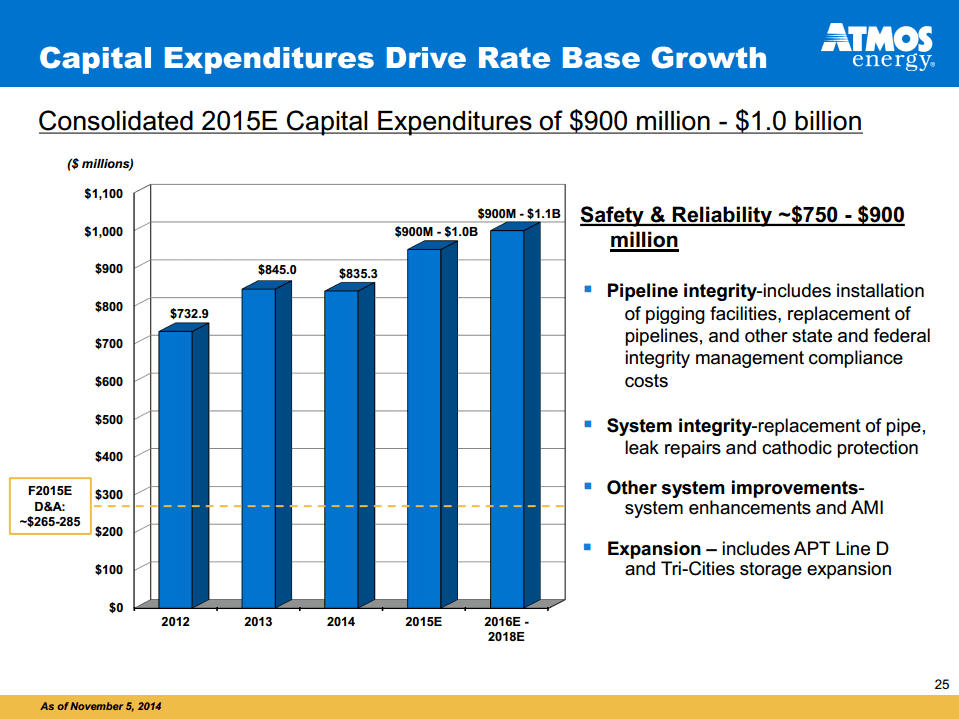
According to the slide presentation, “over 95% of Fiscal 2015E earnings are predictable, regulated, and rate base driven.” This degree of certainty allows ATO management to provide earnings guidance within a 5% band. It also means that the issues of greatest consequence for ATO investors are how fast the company’s rate base will grow, what return it is authorized to earn on that rate base via regulatory filings, and how historically defensive utility stocks will trade in 2015 after outperforming the S&P 500 in 2014. To the first issue, we included the slide on the left above, which points to more than $900 million of annual capex through 2018, rate base growth of 9%-10%, and EPS growth of 6%-8%.
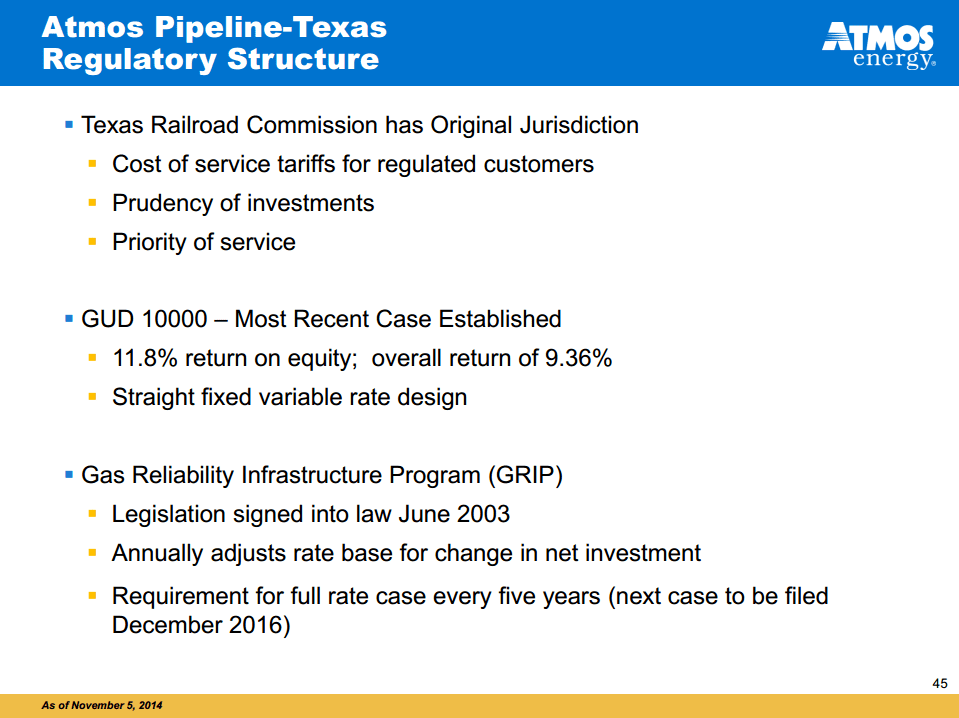
While the slide on the right above may initially strike you as another micro slide, we’ve included it to remind readers that contract structures heavily influence the business risk of an asset, regardless of where that asset sits on the energy value chain. The margins on ATO’s Texas intrastate pipeline business are 100% regulated by the Texas Railroad Commission at a return on equity of 11.8%. The rigidity of this earnings structure stands in stark contrast to Energy Transfer Partners’ (ETP) Texas intrastate pipeline business, which saw margins collapse along with basis differentials over the past six years. Distributions remained flat until CEO Kelcy Warren acquired his way out of the problem.
ONEOK Inc and ONEOK Partners (slide presentation here)

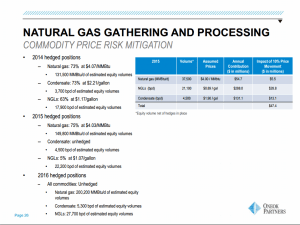
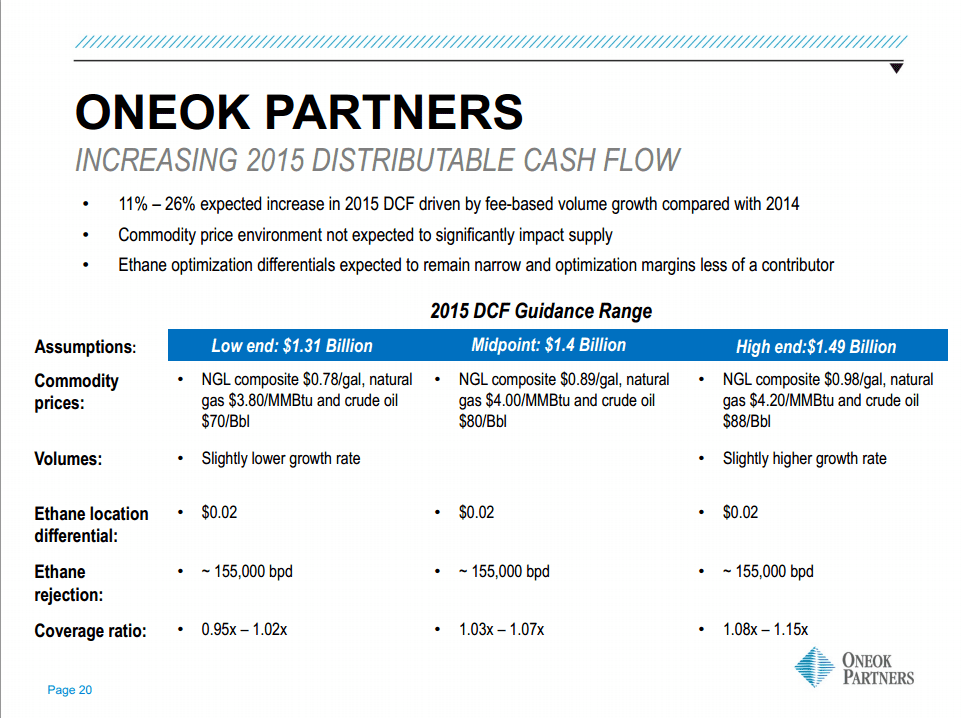
We include the slide on the left above not to deliberately pick on ONEOK, but simply to say that the commodity price assumptions made by companies across the energy value chain less than two months ago probably require some additional sensitivity analysis to the downside. NGL, natural gas, and crude oil prices currently sit more than 25% below the low end of the company’s range, and drilling in all four growth basins mentioned in ONEOK’s presentation is uneconomical today by its own estimation. That said, OKS has outperformed its peers in the Alerian MLP Index (AMZ) and Alerian MLP Infrastructure Index (AMZI) since the analyst day on December 3rd. OKE has had a rougher time, shedding 15% during the same period.
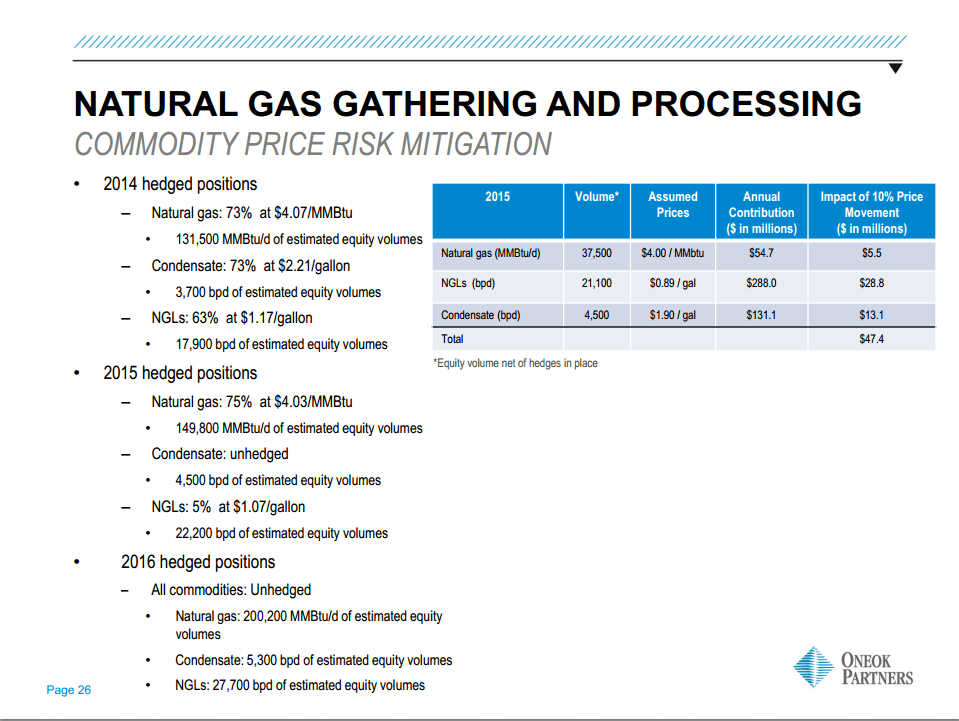
Why do commodity prices matter? Because while throughput is an issue for all energy infrastructure assets, commodity prices also play a direct role in the financial well-being of, among others, G&P names with POP and/or keep-whole contracts. Roughly 70% of ONEOK’s G&P margin has a commodity component to it, none of which was hedged beyond 2015 as of December 3rd. Assuming throughput is consistent with management estimates and prices are equal to 2015 assumptions, OKS expects a margin contribution of $825 million in 2016 from its POP and keep-whole contracts. If prices remain at current levels, that’s equivalent to a haircut of more than $200 million, or 14% of the midpoint of 2015 estimated DCF. Macro point being, the size and duration of hedges matter. NGLs in particular tend to be expensive and/or difficult to cleanly hedge more than 12-18 months out.
Southcross Energy Partners (slide presentation here)


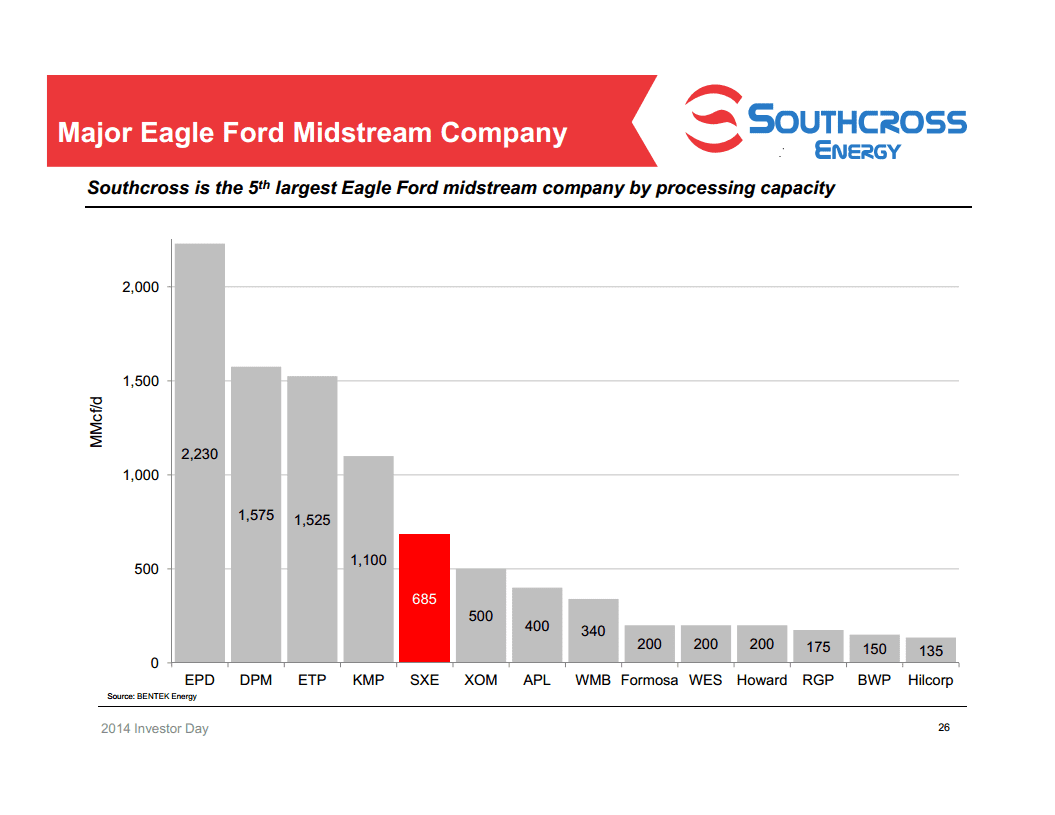
Despite being a small-cap, pure-play Eagle Ford gathering and processing company, SXE spent a fair amount of time going through energy macro slides first. Many of the concepts mentioned are probably familiar to energy investors by now—US oil and gas production growth relative to Russia and Saudi Arabia, US fuel switching from coal to natural gas, recent US production growth largely coming from the Big Three, and breakeven projections meant to calm investors at the time morphing into present-day apocalyptic propaganda given the continued fall in commodity prices. So we turn our attention instead to the above ranking of Eagle Ford midstream companies by processing capacity and ask, with expectations for increased levels of M&A activity in 2015, are these SXE’s potential acquirers given their five financial sponsors?
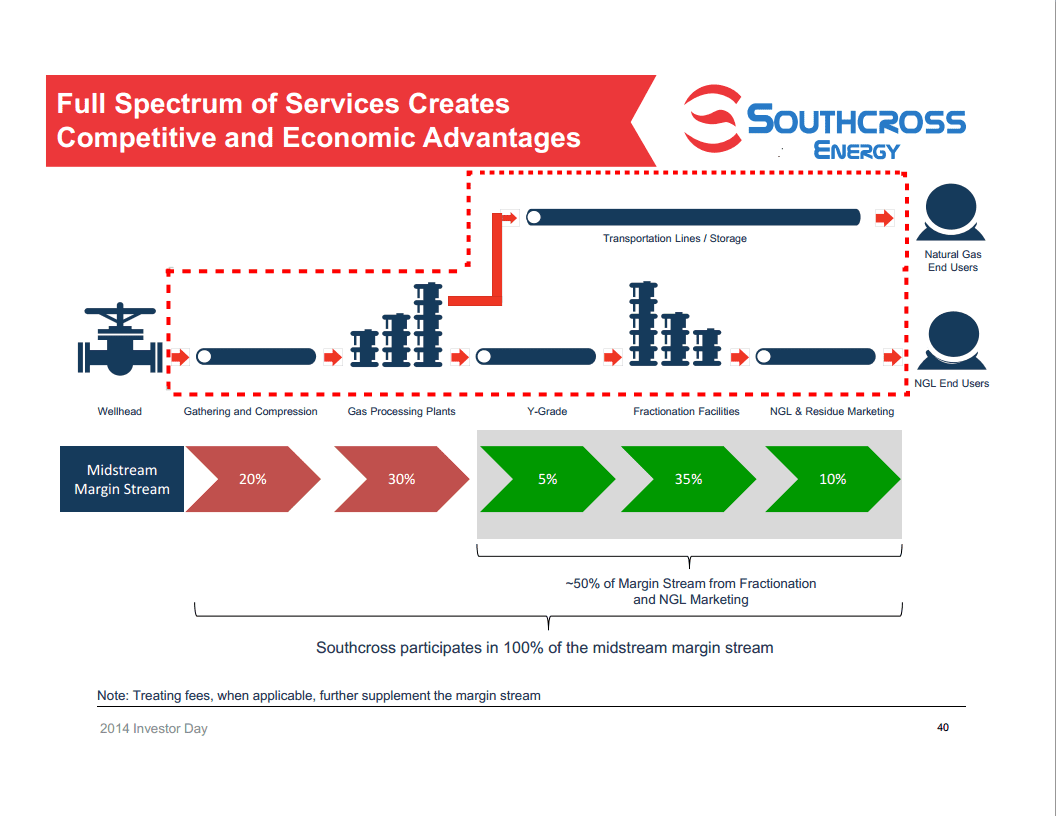
To its right, an interesting midstream margin stream overlay on the energy value chain graphic that infrastructure investors have become very familiar with through IR presentations on company websites. While I assume these percentages apply only to the Eagle Ford where SXE operates, and maybe more specifically only to SXE itself, it does suggest that the big money is in processing plants and fractionators, relatively speaking. This might explain why Enterprise Products Partners (EPD) will be in the double digits soon on large-scale Mont Belvieu fractionators.
Tesoro Corporation and Tesoro Logistics (slide presentation here)
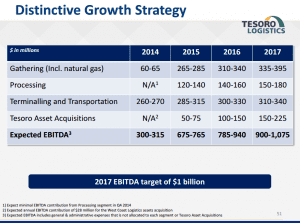
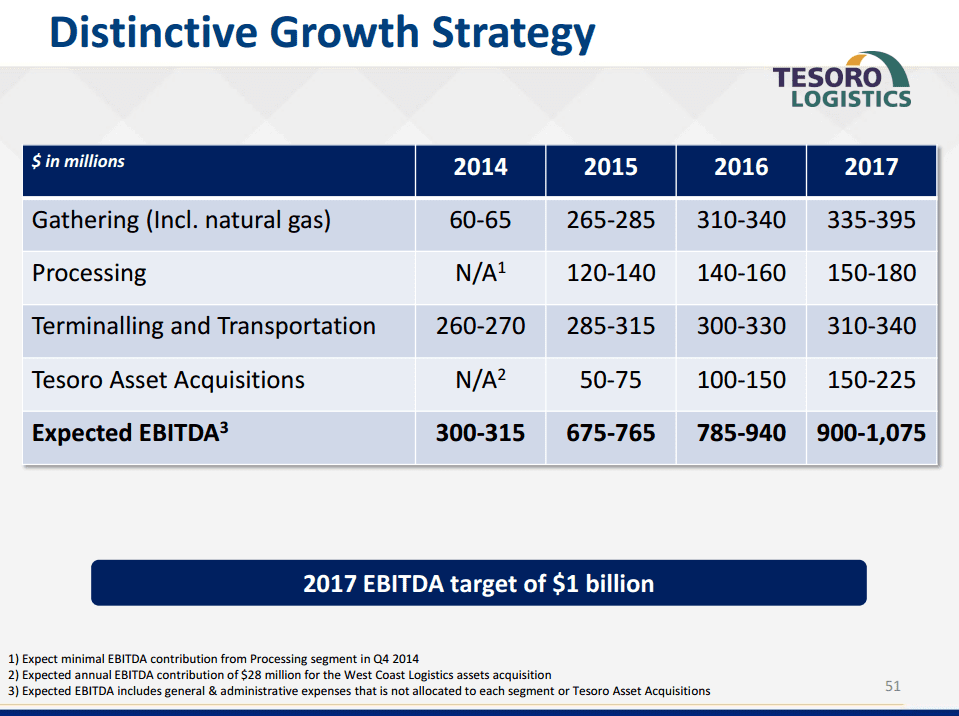
While most investors are more familiar with Tesoro as a refining and marketing company, TLLP has posted a more impressive return, rising 180% including distributions since going public in April 2011, nearly double that of TSO over the same time frame. But TLLP has come under a bit of fire since announcing on October 19 that it would acquire the midstream assets of QEP Resources (QEP) and diversify into the natural gas gathering and processing business. Most analysts and investors panned the decision, which complicated the partnership’s refinery logistics dropdown narrative. But the first slide above may provide some explanation. If 3% baseline EBITDA growth is on the horizon in 2017 in its terminaling and transportation segment, CEO Greg Goff has to find new avenues to sustain growth once the dropdown well eventually dries up, as investors don’t ascribe the premium valuation that TLLP has been afforded thus far to MLPs with 3% annual EBITDA growth. QEP’s midstream business, reflected in the gathering and processing segments, appear to be one such avenue.
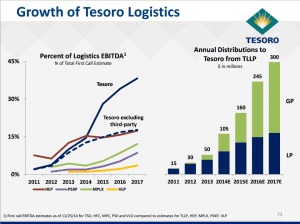
We conclude this analyst day catch-up piggybacking on the M&A theme. Management appears to be suggesting in the above right slide that unlike its R&M peers that formed their own MLPs, TLLP wasn’t taken publicly simply for valuation arbitrage; TSO expects a meaningful component of its EBITDA to come from midstream assets in the near future. This leads to two questions. One, given that HollyFrontier (HFC) no longer has assets to drop down to Holly Energy Partners (HEP), should the latter pursue a diversification strategy as well? And two, at what point in the dropdown lifecycle should an MLP pursue a diversification strategy, assuming investors thought TLLP did it too early and HEP waited too long?

