Summary //
- Yield spread analysis has become an inadequate standalone method for valuing midstream companies as the industry’s emphasis on yield alone has given way to a greater focus on total return.
- Several midstream companies are targeting positive free cash flow after dividends in 2020 and 2021.
- Valuations focused on cash flows, such as free cash flow yield and price-to-cash-flow, better reflect today’s midstream companies and are more suitable valuation tools than yield-based metrics.
Given the high relative yields of the sector, investors have long turned to energy infrastructure companies, particularly MLPs, as a source of income in their portfolios. Valuations for the sector have historically been viewed through the lens of that dividend yield. However, as the industry has shifted away from prioritizing dividend payouts to a focus on capital discipline, stronger balance sheets and free cash flow generation, these income-oriented valuation methods have become outdated. In the first half of our two-part series on valuations, we discuss why yield spread analysis is less relevant for today’s midstream companies and what methods would better serve investors trying to evaluate the energy infrastructure space. To be clear, midstream continues to offer attractive income opportunities, but yield on its own is not an adequate valuation tool.
Yield spread analysis has become outdated.
Historically, one of the most common ways to value the MLP/midstream space has been to compare dividend yields to that of the 10-year US Treasury. As we discussed at length in our April 2019 whitepaper (read here), midstream companies have mostly deemphasized dividend growth, which did not seem to be rewarded in equity prices, to focus more on self-funding equity capital and enhancing financial flexibility by reducing debt. These changes since the 2014-16 downturn in oil prices represented a notable shift from the playbook prior to 2014 when many MLPs were reliant on equity capital markets to fuel growth while they maintained a high yield. In short, the yield spread valuation has become less relevant as the industry has pivoted to a more total-return focus. In our recent conversations with investors, however, many have cited yield spread analysis in evaluating the opportunity set in midstream given that dividend yields for both the Alerian MLP Infrastructure Index (AMZI) and Alerian Midstream Energy Select Index (AMEI) are well above historical averages and the Federal Reserve has pledged to hold interest rates near zero through 2022. Yields for the AMZI and AMEI are currently 1,011 basis points and 732 basis points above the 10-year Treasury rate of 0.70% as of June 12 compared to five-year averages of 605 basis points and 380 basis points, respectively.
While spreads between midstream yields and US Treasuries have widened, which could imply that midstream is undervalued, analyzing yield spreads in isolation remains an inadequate gauge of value for energy infrastructure securities. By focusing solely on dividend yield, investors may not be accounting for the evolution of the midstream business model and could fail to capture company-level improvements made in recent years, including a shift to self-funding equity capital, stronger balance sheets, and, in some cases, share buyback programs. While yields provide some indication of risk and value, they are not comprehensive for evaluating companies, especially in turbulent markets. As an example, a higher than average yield traditionally indicates greater risk of dividend cuts, but midstream payouts are generally more secure today than they were six months ago after several cuts in 1Q20, even if the yield spread has widened over that time period. In short, relatively high and resilient payouts continue to represent an opportunity for income-oriented investors in the current yield-starved market, but this factor should not be the only consideration in midstream valuations.
As midstream approaches free cash flow inflection…
Given the shift away from maximizing dividend growth and emphasis on capital discipline, several midstream companies are targeting positive free cash flow after dividends for the first time in 2020 or 2021. Free cash flow generation should allow midstream companies to further enhance liquidity and strengthen their balance sheets, which is especially beneficial given the uncertainty that continues to cloud the outlook for near-term energy demand and prices. Crestwood Equity Partners (CEQP) and Williams (WMB), which were both guiding to free cash flow generation coming into the year, restated their intentions to achieve positive free cash flow in 2020. Similarly, Energy Transfer (ET) and MPLX (MPLX) are projecting post-distribution free cash flow in 2021. Each of these companies was targeting lower year-over-year growth capital spending coming into 2020, and apart from WMB, all have further reduced capex guidance since oil prices collapsed. While decreased capital spending lowers the hurdle for free cash flow generation, it should be noted that all these companies maintained their 1Q20 dividends sequentially. A few other midstream companies, including EnLink Midstream (ENLC) and Targa Resources (TRGP), have also discussed free cash flow generation this year, but these targets have been driven in part by recent dividend cuts. As capital spending broadly declines across midstream following a massive build-out of North American energy infrastructure in recent years (read more), positive free cash flow after dividends could continue to become more common among midstream companies.
…cash flow-focused valuations are becoming more relevant.
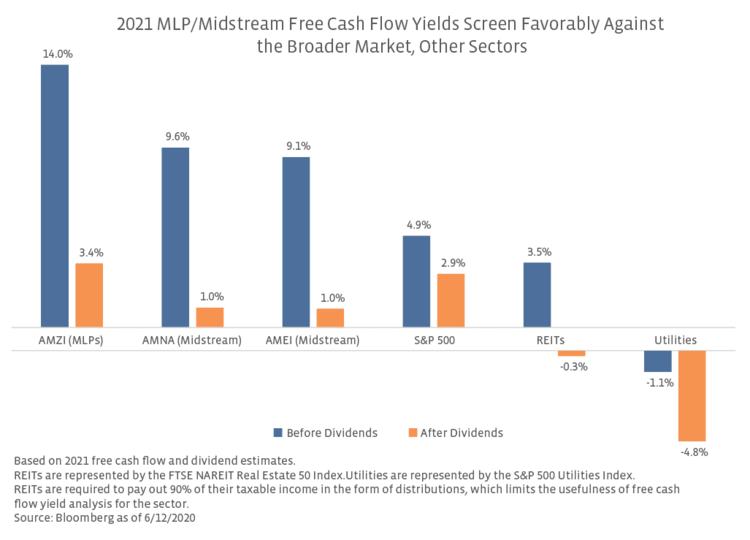
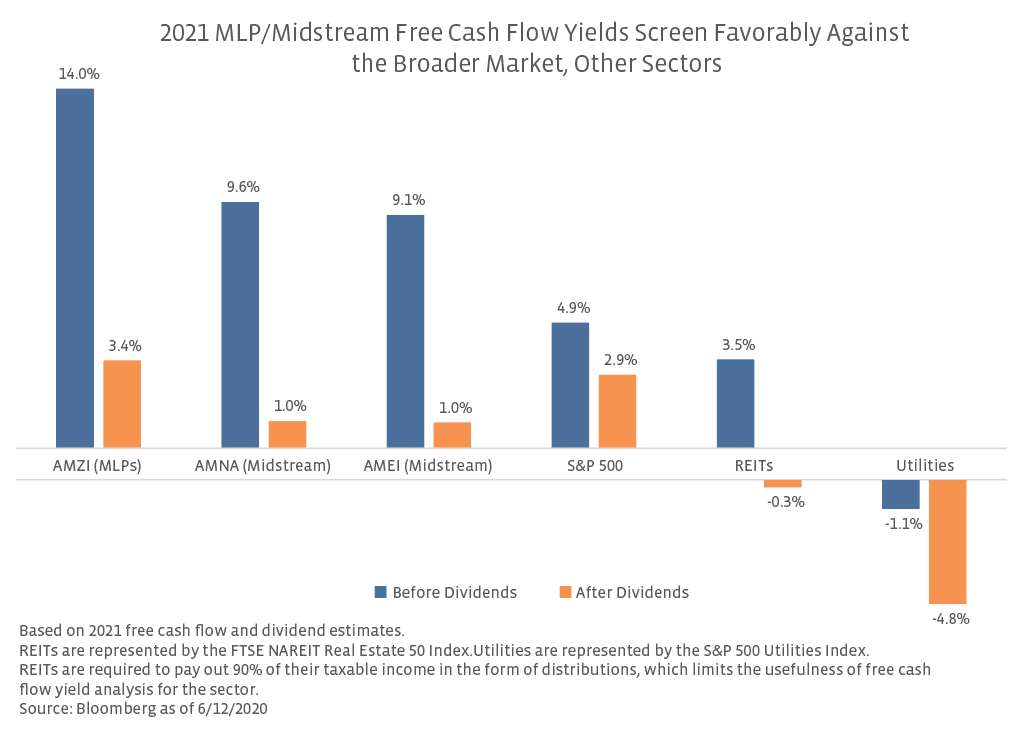
As free cash flow generation gains traction among energy infrastructure companies, valuation methods that emphasize cash flows have become more applicable to the midstream space. When compared to yield-focused valuations, these metrics better capture the evolution of midstream businesses, provide a more holistic overview of a company’s financial standing, and put the industry on equal footing with other sectors for generalist investors who may not be familiar with industry-specific valuation methods. Free cash flow yield, which compares a company’s free cash flow to its market capitalization, may be the most effective in this regard. The chart below shows forward free cash flow yields before and after dividends for the AMZI, AMEI, and Alerian Midstream Energy Index (AMNA) compared to other income-oriented sectors and the broader market. Current free cash flow yields are a testament to how far the industry has come in recent years. Per Bloomberg, the free cash flow yield before distributions for the AMZI was negative as recently as 2016 and was only 5.2% in 2019 compared to 14.0% based on estimated 2021 free cash flow as of June 12. While free cash flow yields prior to dividend payments may paint a more compelling picture of the space, the excess cash flow after the dividend is likely of more interest to investors as it provides a clearer gauge of the cash left over to reduce debt or enhance shareholder returns. AMZI’s 2021 free cash flow yield drops from 14.0% before distributions to 3.4% after distributions but remains 55 basis points above the same post-dividend metric for the S&P 500. Both midstream indexes (AMNA and AMEI) yield less than their MLP counterpart and the broader market but still generate a positive free cash flow yield after dividends, unlike REITs and utilities. Whether an investor prefers to evaluate midstream free cash flow yields before or after dividends, the midstream metrics for 2021 reflect increasing financial flexibility amid market uncertainty, driven by moderating capital spending, recent project completions, and stable fee-based cash flows (read more).


