ETFdb Logo
  • ETF Database
  • Content Hubs
    • Themes
      • Active ETF
      • Alternatives
      • Artificial Intelligence
      • China Insights
      • Core Strategies
      • Crypto
      • Disruptive Technology
      • Energy Infrastructure
      • ETF Building Blocks
      • ETF Investing
      • ETF Strategist
      • Financial Literacy
      • Fixed Income
      • Free Cash Flow
      • Future ETFs
      • Innovative ETFs
      • Institutional Income Strategies
      • Leveraged & Inverse
      • Market Insights
      • Market Outlooks
      • Modern Alpha
      • Nuclear Energy
      • Portfolio Strategies
      • Sector Investing
      • Tax Efficient Income
      • Thematic Investing
    • Asset Class
      • Equity
        • U.S. Equity
        • Int'l Developed
        • Emerging Market Equities
      • Alternatives
        • Gold/Silver/Critical Materials
        • Cryptocurrency
        • Currency
        • Volatility
      • Fixed Income
        • Investment Grade Corporates
        • US Treasuries & TIPS
        • High Yield Corporates
        • Int'l Fixed Income
    • ETF Ecosystem
    • ETFs in Canada
    • Market Outlook
    • Crypto ETF Hub
  • Tools
    • ETF Screener
    • ETF Country Exposure Tool
    • ETF Database Categories
    • Indexes
    • Scenario Analysis
    • Watchlists
    • Head-To-Head ETF Comparison Tool
    • Mutual Fund To ETF Converter
    • ETF Stock Exposure Tool
    • ETF Issuer Fund Flows
  • Research
    • ETF Education
    • Equity Investing
    • Dividend ETFs
    • Leveraged ETFs
    • Inverse ETFs
    • Index Education
    • Index Insights
    • Top ETF Sectors
    • Top ETF Issuers
    • Top ETF Industries
  • Webcasts
  • Sectors
    • Sector Investing Content Hub
    • XLK
    • XLI
    • XLU
    • XLY
    • XLP
    • XLRE
    • Sector Power Rankings
    • XLE
    • XLC
    • XLF
    • XLV
    • XLB
  • Multimedia
    • ETF 360 Video Series
    • ETF of the Week Podcast
    • Gaining Perspective Podcast
    • ETF Prime Podcast
    • Video
  • Company
    • About VettaFi
  • PRO
    • Pro Content
    • Pro Tools
    • Advanced
    • FAQ
    • Free sign up
    • Login
  1. Index Insights
  2. Monday Mailbag: Am I or Am I Not Invested in Upstream MLPs?
Index Insights
Share

Monday Mailbag: Am I or Am I Not Invested in Upstream MLPs?

Karyl PatredisOct 04, 2015
2015-10-04

What percentage of the Alerian MLP Infrastructure Index (AMZI) consists of upstream names?

The AMZI contains no upstream names. This index is 100% infrastructure and the sector weightings as of September 30th are 43% Petroleum Transportation, 15% Natural Gas Transportation, and 42% Gathering & Processing. That means, if you own AMLP, MLPI, MLPL, or any of the Canadian return of capital notes, you do not have direct upstream exposure. I repeat: you do not have direct upstream exposure.

The Alerian MLP Index (AMZ) does contain a small sliver of upstream exposure, however. If you own AMJ or AMU, this is applicable to you.

There are currently 125 energy MLPs and of those, 17 are upstream names:

This is the image alt text

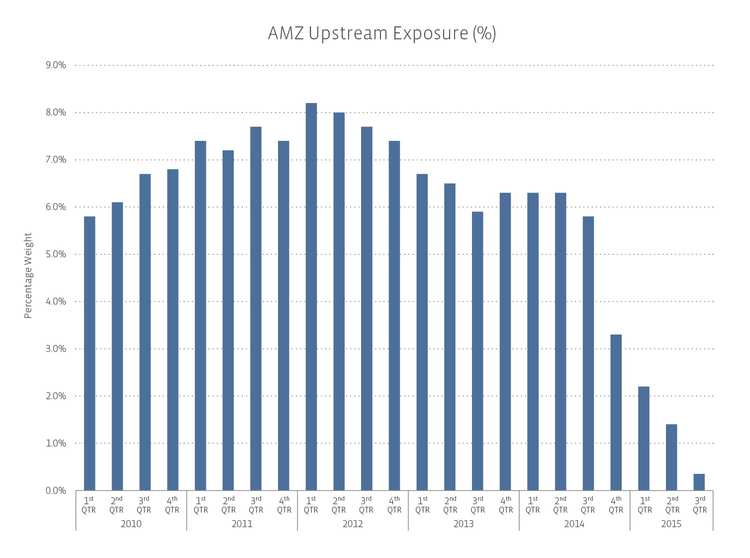
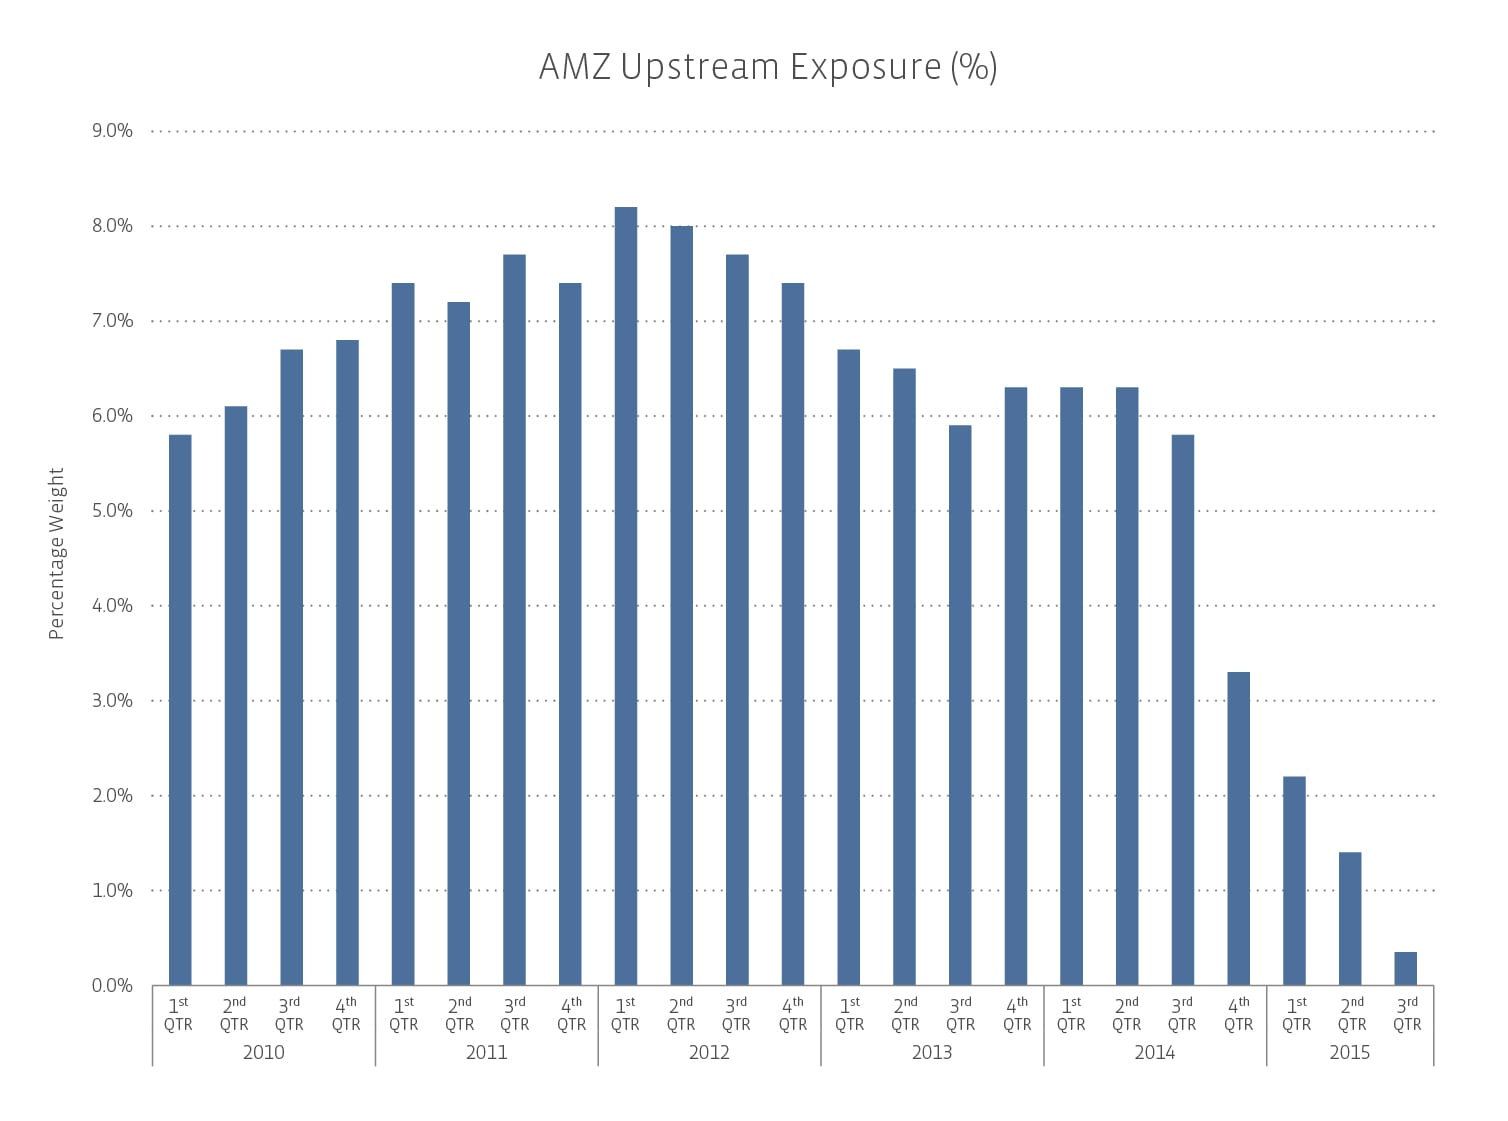
As of the special rebalancing which took place at the close of business on October 1st, only Vanguard Natural Resources (VNR) is a member of the AMZ, and its weight was a mere 0.35%. The highest exposure the AMZ has had to upstream companies over the past five years was 8.2% in early 2012, with a total of 15 upstream companies in the index. Over the past year, however—I’m stating the obvious here—lower commodity prices and distribution cuts have driven the equity values of upstream names down, resulting in a significant decline in both the absolute number and weight of upstream names in the index.


Content continues below advertisement

upstream_names_in_amz-01

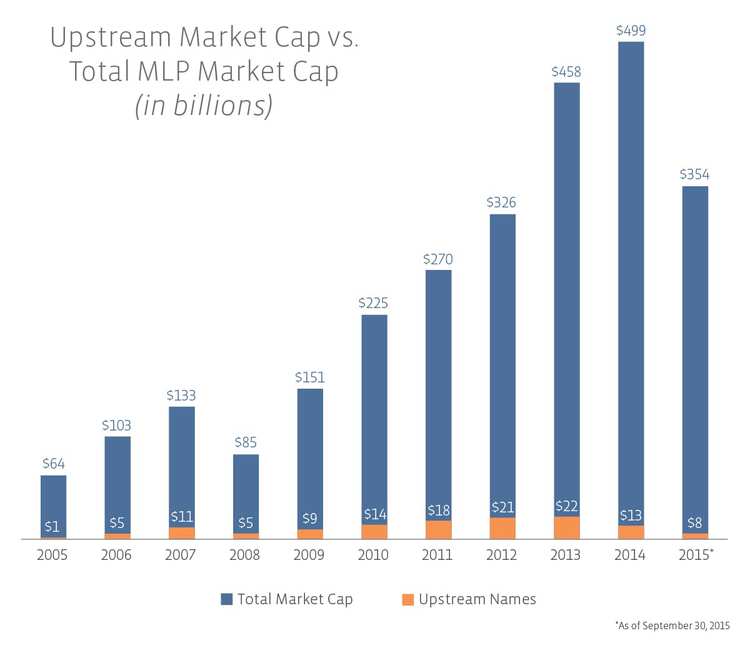
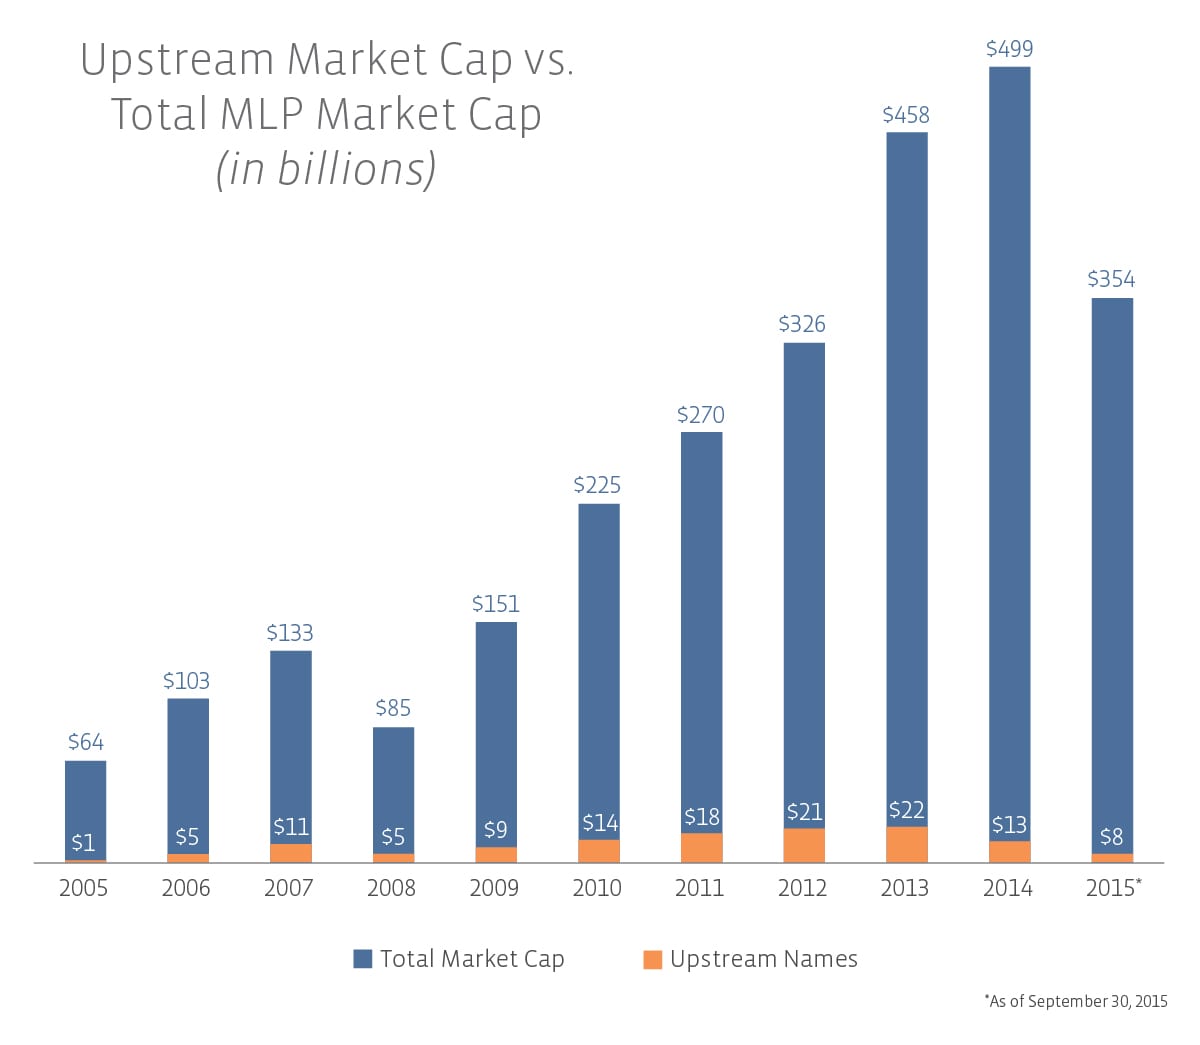
Looking at the broader MLP space, as of September 30th, the total market cap was $354 billion. Of that, only $8 billion, or 2.3%, was attributed to upstream businesses. Truth be told, upstream companies have never captured a significant portion of the MLP market cap. At its height in 2007, only 8%, or $5 billion of the $133 billion market cap, belonged to upstream names.

Upstream Names to Total MLP Market Cap-01

It’s important for MLP investors to remember that only a small percentage of MLPs have cash flows directly exposed to commodity prices. Most MLPs are instead indirectly exposed to commodity prices through volumes.

For future reference, all of our fact sheets contain sector exposure breakdown and can be downloaded from each index’s respective page.


» Popular Pages

  • Tickers
  • Articles

Jun 22

U.K. Nuclear: Scaling Up at Home & Abroad

Jun 22

Core Alpha, Mass Scale: How Capital Group Shifted the Active ETF Playbook

Jun 18

S&P 500 Snapshot: Peace Deal Overcomes Fed Jitters

Jun 18

Treasury Yields Snapshot: June 18, 2026

Jun 18

Volatility Protection & Income in a Dynamic Buffered ETF

Jun 18

Covered Call ETFs Have Boomed – But Can They Be More?

Jun 18

Dimensional Consolidates $250B Lineup Into ETF Share Classes

Jun 18

NUKZ Holding Constellation Injects Millions Into Local Economies

Jun 18

What Drives Active ETF Growth? NEOS and Thornburg Weigh In

Jun 18

Capital Rotation: A Breakdown of This Week's Top ETF Flows

QQQ

Invesco QQQ Trust Series I

VOO

Vanguard S&P 500 ETF

SMH

VanEck Semiconductor ETF

GLD

SPDR Gold Shares

SOXX

iShares Semiconductor ETF

DRAM

Roundhill Memory ETF

SCHD

Schwab US Dividend Equity ETF...

PPLT

abrdn Physical Platinum...

SOXL

Direxion Daily Semiconductor...

XLK

State Street Technology...

Loading Articles...

Advertisement

Is Your Portfolio Positioned With Enough Global Exposure?

ETF Education Channel

How to Allocate Commodities in Portfolios

Tom LydonApr 26, 2022
2022-04-26

A long-running debate in asset allocation circles is how much of a portfolio an investor should...

Core Strategies Channel

Why ETFs Experience Limit Up/Down Protections

Karrie GordonMay 13, 2022
2022-05-13

In a digital age where information moves in milliseconds and millions of participants can transact...

}
X