ETFdb Logo
  • ETF Database
  • Content Hubs
    • Themes
      • Active ETF
      • Alternatives
      • Artificial Intelligence
      • China Insights
      • Core Strategies
      • Crypto
      • Disruptive Technology
      • Energy Infrastructure
      • ETF Building Blocks
      • ETF Investing
      • ETF Strategist
      • Financial Literacy
      • Fixed Income
      • Free Cash Flow
      • Future ETFs
      • Innovative ETFs
      • Institutional Income Strategies
      • Leveraged & Inverse
      • Market Insights
      • Market Outlooks
      • Modern Alpha
      • Nuclear Energy
      • Portfolio Strategies
      • Sector Investing
      • Tax Efficient Income
      • Thematic Investing
    • Asset Class
      • Equity
        • U.S. Equity
        • Int'l Developed
        • Emerging Market Equities
      • Alternatives
        • Gold/Silver/Critical Materials
        • Cryptocurrency
        • Currency
        • Volatility
      • Fixed Income
        • Investment Grade Corporates
        • US Treasuries & TIPS
        • High Yield Corporates
        • Int'l Fixed Income
    • ETF Ecosystem
    • ETFs in Canada
    • Market Outlook
    • Crypto ETF Hub
  • Tools
    • ETF Screener
    • ETF Country Exposure Tool
    • ETF Database Categories
    • Indexes
    • Scenario Analysis
    • Watchlists
    • Head-To-Head ETF Comparison Tool
    • Mutual Fund To ETF Converter
    • ETF Stock Exposure Tool
    • ETF Issuer Fund Flows
  • Research
    • ETF Education
    • Equity Investing
    • Dividend ETFs
    • Leveraged ETFs
    • Inverse ETFs
    • Index Education
    • Index Insights
    • Top ETF Sectors
    • Top ETF Issuers
    • Top ETF Industries
  • Webcasts
  • Sectors
    • Sector Investing Content Hub
    • XLK
    • XLI
    • XLU
    • XLY
    • XLP
    • XLRE
    • Sector Power Rankings
    • XLE
    • XLC
    • XLF
    • XLV
    • XLB
  • Multimedia
    • ETF 360 Video Series
    • ETF of the Week Podcast
    • Gaining Perspective Podcast
    • ETF Prime Podcast
    • Video
  • Company
    • About VettaFi
  • PRO
    • Pro Content
    • Pro Tools
    • Advanced
    • FAQ
    • Free sign up
    • Login
  1. Index Insights
  2. Monday Mailbag: May the 4th Be with You
Index Insights
Share

Monday Mailbag: May the 4th Be with You

Karyl PatredisMay 04, 2015
2015-05-04

What’s going on with crude oil storage?

Well, it’s happened. I’ve been married for two whole years as of today. Yes, we chose to get married on Star Wars Day, but it was more about the date our venue had available than our love of lightsabers.

Getting married in your thirties has its advantages, but one drawback is the massive amount of “stuff” two thirty-somethings bring to a household when they’ve each been living on their own for 10-plus years. Our attic is full and we have now succumbed to using one of the upstairs bedrooms as a “junk room”. It’s safe to say the storage levels at our house are at capacity, but is the same true for US crude oil?

Let’s take a peek at this storage tank diagram courtesy of the US Energy Information Administration (EIA).

2015.04.05 Tank Storage

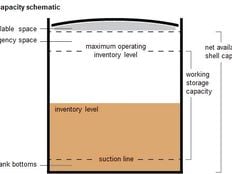
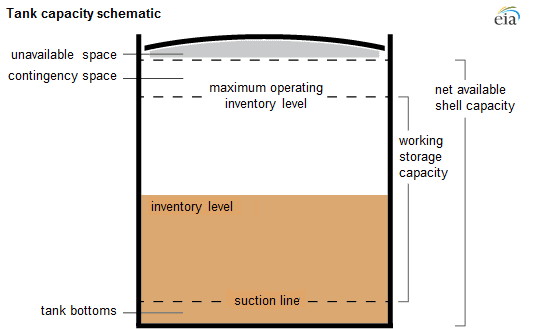
According to the EIA’s most recent assessment, there are 521 million barrels of total working storage capacity in the US. Net available shell capacity (another frequently quoted number) includes contingency space and tank bottoms and is not part of this calculation. Evidently, contingency space is not used in the course of normal operations, but the EIA tells us that it can allow “flexibility to exceed working storage capacity without creating safety hazards or operational disruptions.” With this in mind, realize that when we review the most recent crude oil stockpiles, there’s more storage actually available than is used in the calculation.

As of April 24th, about 491 million barrels of oil were being stored in the US. That’s 94% of the capacity number mentioned above y’all. But the EIA suggests that around 120 million of these “stored” barrels are tied up in the pipelines, produced but not yet in the supply chain, or on a ship in transit from Alaska which does not take up any space in the tanks or underground caverns that make up the 521 million barrels of capacity. Removing the estimated 120 million barrels from our April 24th figure takes the utilization percentage down to a much more reasonable 71%.

Below is a chart we made to show the utilization rates in each of the five Petroleum Administration for Defense Districts (PADDs).


Content continues below advertisement

2015.04.05 PADD Storage Capacity

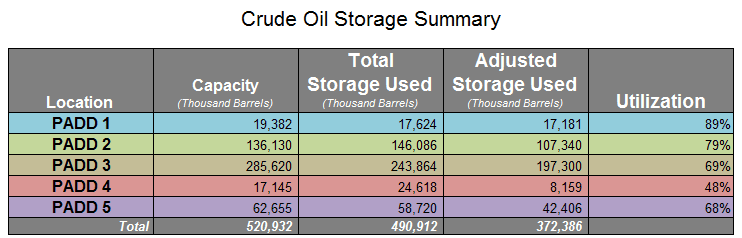
Capacity data compiled based on September 30, 2014 EIA Working Storage Capacity by PAD District
Total Storage Used is based on EIA Crude Oil Stock data as of April 24, 2015
*Inventory adjustments for pipeline fill, lease stocks, or oil in transit from Alaska based on correction percentages used in this EIA chart

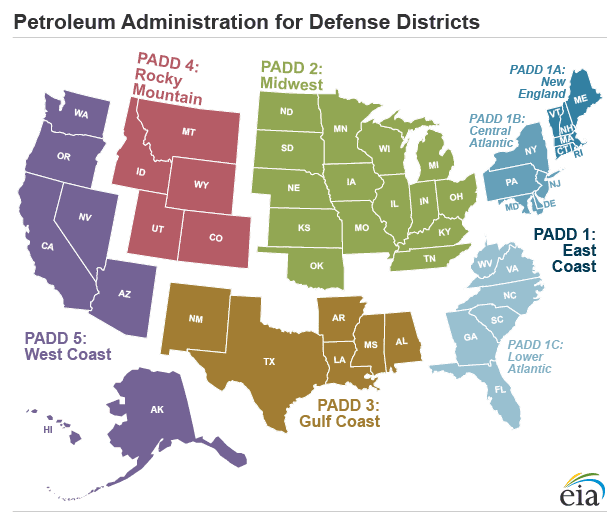
In case you don’t have the PADDs memorized, check out this EIA map.

2015.04.05 PADD Districts

Cushing, Oklahoma is in PADD 2. As of April 24th, the EIA reports that the utilization rate of the 71 million barrels of storage capacity available specifically at Cushing is 87%, causing some lease rates to skyrocket to $0.80 per barrel per month from $0.20.

In the end, companies and traders must evaluate if paying storage premiums or moving their oil to a less congested PADD (and paying associated transportation costs) is worth it from a contango spread standpoint. As for the fear that storage is going to run out and oil prices are going to crash to $20, this seems to be an unlikely scenario. While Cushing may be filling up, there is still space for over 88 million barrels in PADD 3. As 2015 continues, it will be interesting to see if companies find that paying additional transportation costs to store crude in other locations is worthwhile. Similarly, it will be interesting to see if my husband notices that I am slowly sneaking boxes out of the junk room and transporting them to Goodwill.

» Popular Pages

  • Tickers
  • Articles

Jun 23

Active Tech ETF GTEK Delivers Smashing YTD Performance

Jun 23

Biotech ETFs Gain Momentum via AI Drug Discovery & Surging M&A

Jun 23

Bitcoin Miners Are Winning the AI Boom

Jun 23

Which Route During a Tech Rout? Two Low Volatility ETFs

Jun 23

Active ETFs Hit Record $2.49T in Assets Through May

Jun 23

Capture Midcap Momentum With XMMO's Surprising Sector Tilts

Jun 23

SpaceX Takes Center Stage in HALX June Rebalance

Jun 23

High Yield Continues to Drift Toward Higher Quality

Jun 23

National Bank Launches New NBI Thematic Rotation ETF

Jun 23

REIT ETFs: Real Estate's Quiet Revival

QQQ

Invesco QQQ Trust Series I

VOO

Vanguard S&P 500 ETF

DRAM

Roundhill Memory ETF

SMH

VanEck Semiconductor ETF

GLD

SPDR Gold Shares

SOXX

iShares Semiconductor ETF

PPLT

abrdn Physical Platinum...

SIVR

abrdn Physical Silver Shares...

FOTO

Tuttle Capital Pure Play...

AIS

VistaShares Artificial...

Loading Articles...

Advertisement

Is Your Portfolio Positioned With Enough Global Exposure?

ETF Education Channel

How to Allocate Commodities in Portfolios

Tom LydonApr 26, 2022
2022-04-26

A long-running debate in asset allocation circles is how much of a portfolio an investor should...

Core Strategies Channel

Why ETFs Experience Limit Up/Down Protections

Karrie GordonMay 13, 2022
2022-05-13

In a digital age where information moves in milliseconds and millions of participants can transact...

}
X