ETFdb Logo
ETFdb Logo
  • ETF Database
  • Channels
    • Themes
      • Active ETF
      • Artificial Intelligence
      • Beyond Basic Beta
      • China Insights
      • Climate Insights
      • Core Strategies
      • Crypto
      • Disruptive Technology
      • Energy Infrastructure
      • ETF Building Blocks
      • ETF Investing
      • ETF Education
      • ETF Strategist
      • Financial Literacy
      • Fixed Income
      • Free Cash Flow
      • Innovative ETFs
      • Institutional Income Strategies
      • Leveraged & Inverse
      • Managed Futures
      • Market Insights
      • Modern Alpha
      • Multifactor
      • Responsible Investing
      • Retirement Income
      • Tax Efficient Income
    • Asset Class
      • Equity
        • U.S. Equity
        • Int'l Developed
        • Emerging Market Equities
      • Alternatives
        • Commodities
        • Gold/Silver/Critical Minerals
        • Currency
        • Volatility
      • Fixed Income
        • Investment Grade Corporates
        • US Treasuries & TIPS
        • High Yield Corporates
        • Int'l Fixed Income
    • ETF Ecosystem
    • ETFs in Canada
  • Tools
    • ETF Screener
    • ETF Country Exposure Tool
    • ETF Sector Tracker Tool
    • ETF Database Categories
    • Head-To-Head ETF Comparison Tool
    • ETF Stock Exposure Tool
    • ETF Issuer Fund Flows
    • Indexes
    • Mutual Fund To ETF Converter
  • Research
    • ETF Education
    • Equity Investing
    • Dividend ETFs
    • Leveraged ETFs
    • Inverse ETFs
    • Index Education
    • Index Insights
    • Top ETF Sectors
    • Top ETF Issuers
    • Top ETF Industries
  • Webcasts
  • Themes
    • AI ETFs
    • Blockchain ETFs
    • See all Thematic Investing ETF themes
    • ESG Investing
    • Marijuana ETFs
  • Multimedia
    • ETF 360 Video Series
    • ETF of the Week Podcast
    • ETF Prime Podcast
    • Video
  • Company
    • About VettaFi
    • Get VettaFi’ed
  • PRO
    • Pro Content
    • Pro Tools
    • Advanced
    • FAQ
    • Pricing
    • Free Sign Up
    • Login
  1. Index Insights
  2. Visual Data: MLP Treemaps 2.0
Index Insights
Share

Visual Data: MLP Treemaps 2.0

Karyl PatredisApr 23, 2017
2017-04-23

In 2014, we took all the energy MLPs and dumped them into a rectangle. We then broke the rectangle out into individual pieces labeled with the tickers of each company. The pieces were then sized according to each MLP’s relative market cap. This treemap allowed investors to get a snapshot of the MLP space in an easily digestible visual.

When taking a walk down memory lane last week, I ran across this map and realized a lot has changed since the 2014 treemap was created. For starters, Kinder Morgan Inc. (KMI) hadn’t yet rolled up its MLPs. The old Kinder Morgan Energy Partners (KMP) took up a sizeable chunk of the rectangle. Also, the two smallest MLPs that were mentioned at the time (Oxford Resource Partners and Central Energy Partners) are now dust in the wind. There were 116 MLPs reflected in the September 2014 treemaps. As of March 31, 2017, there are 108. Because of all these changes, I thought an updated treemap was in order. First, let’s look at a simple map of all 108 MLPs.

This is the image alt text

(click to enlarge)

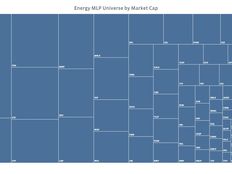
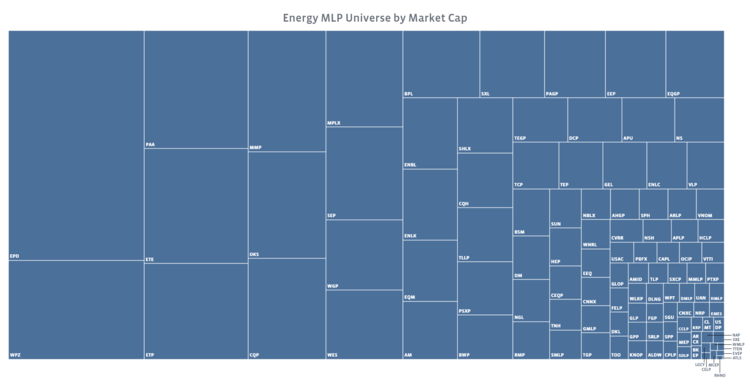
The total energy MLP market cap is around $400 billion. With a market cap of almost $60 billion, Enterprise Products Partners (EPD) is the largest MLP. Second is Williams Partners (WPZ) at approximately $25 billion. Notably, WPZ will not likely hold the title of second largest for much longer. Assuming the planned Energy Transfer Partners (ETP)/Sunoco Logistics Partners (SXL) merger is approved this week, the newly formed company will take the red ribbon.

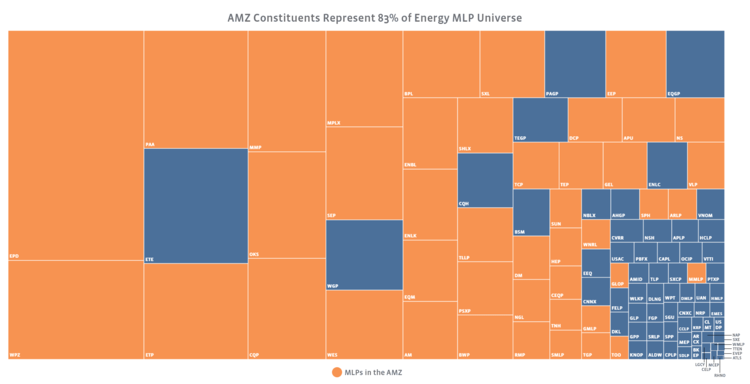
The version of the treemap below highlights the tickers of the 44 companies that are constituents of the AMZ.


Content continues below advertisement

This is the image alt text

(click to enlarge)

The AMZ market cap is about $336 billion, representing roughly 83% of the total MLP market cap. MLP GPs account for many of the larger holes in the block of orange. Such companies are excluded from index eligibility as explained in our methodology guide.

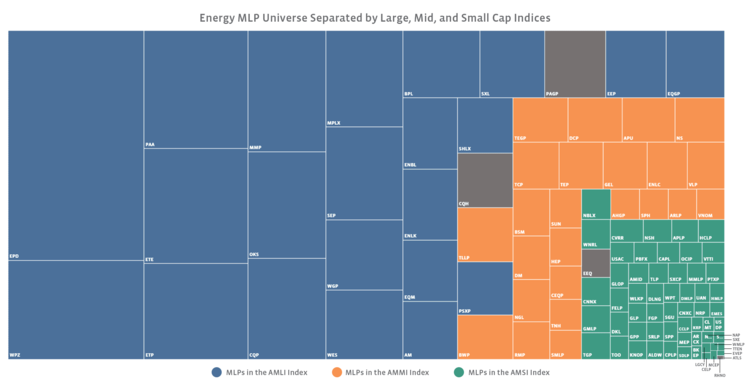
Next, we’ll look at the treemap with the MLPs divided by our size indices. The Alerian Large Cap MLP Index (AMLI) contains energy MLPs that have a market cap in the top 70% of total market cap. The Alerian Mid Cap MLP Index (AMMI) captures the next 20% and the Alerian Small Cap MLP Index (AMSI) is composed of the bottom 10%.

This is the image alt text

(click to enlarge)

If you’re wondering why some of the boxes are greyed, there are a few reasons. Institutional shares, such as Enbridge Energy Management (EEQ), as well as taxable equivalent shares, such as Cheniere Energy Partners LP Holdings (CQH) and Plains GP Holdings (PAGP), are ineligible. Also, MLPs must have a market cap of at least $75 million to be included, which is why Atlas Energy Group (ATLS) and Rhino Resource Partners (RHNO) aren’t in the AMSI.

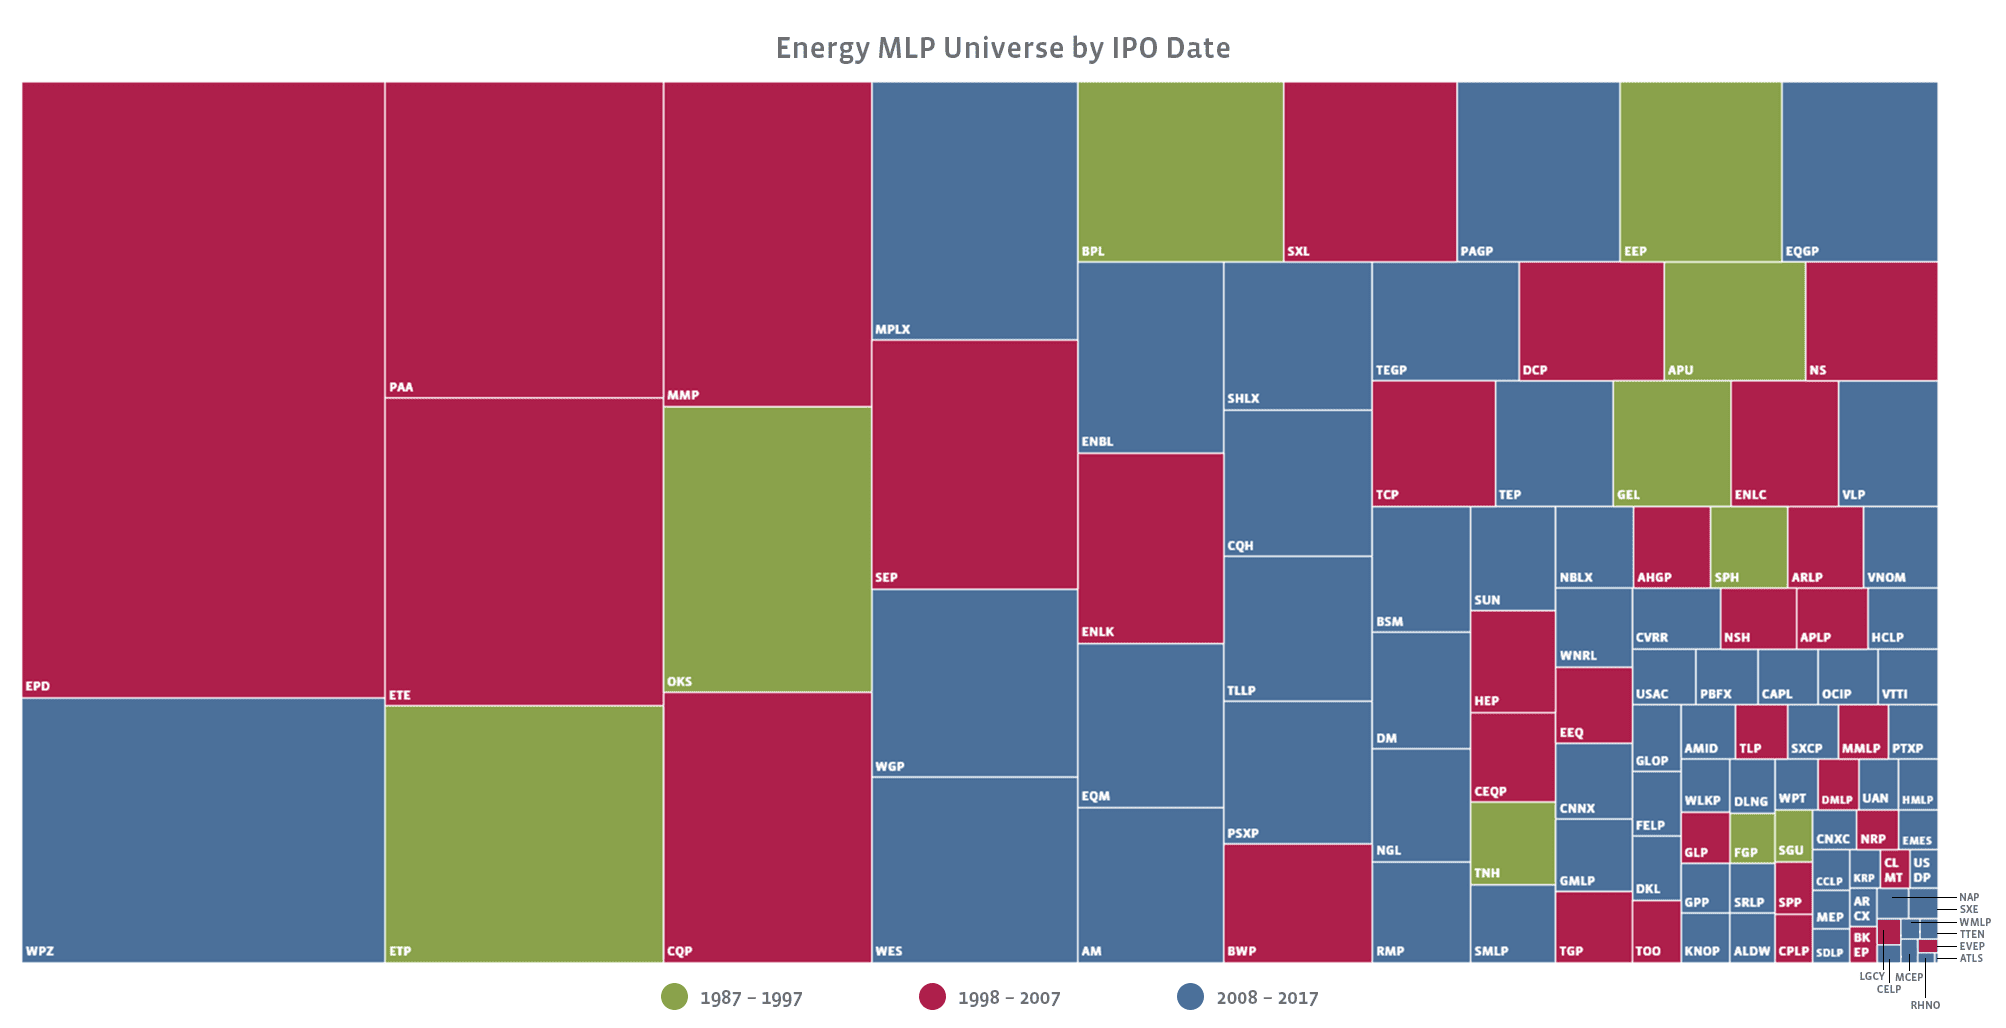
Finally, we’ll look at the age of the MLPs in our treemap.
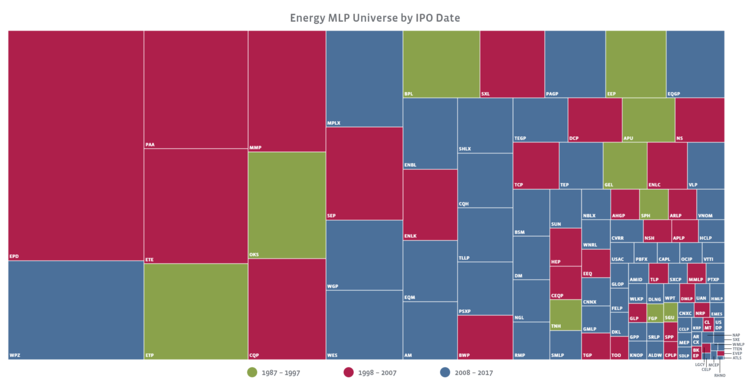
This is the image alt text

(click to enlarge)

Every now and then you’ll run across a photo or story that reminds you age is just a number. In many ways, this treemap backs that saying up (albeit not nearly as cool as a grandma who DJs). What I mean by this is it’s not necessarily the oldest MLPs that are the largest or the youngest MLPs that are the smallest. True, some MLPs like Magellan Midstream Partners (MMP) and Plains All American Pipeline (PAA) that have been around for 15+ years have grown a lot, but organic growth is not the only way to be a heavy hitter. Some MLPs started off larger thanks to being formed by a parent and receiving sizable dropdowns.

Have other ideas for interesting treemap variations? If so, tell us by emailing index@alerian.com.

» Popular Pages

  • Tickers
  • Articles

Oct 03

Four ETFs for Consistent Income in Equities

Oct 03

ETF Prime: Hendrickson and Edmondson on EQM Indexes Plus Thematic Investing

Oct 03

Sovereign’s Fund Invests in "Most Spiritually Integrated" Companies

Oct 03

Navigating a 401(k) Rollover

Oct 03

Treasuries Grab the Wheel

Oct 03

An Upside in Equal-Weight ETF SDOG

Oct 03

Dollar Dollar Bill, Y'all!

Oct 03

Top 5 Active ETFs Beating Rivals on Fees

Oct 03

Once in a Decade Opportunity to Diversify Away From the “Magnificent 7”

Oct 03

Top Performing Leveraged/Inverse ETFs: 10/01/2023

QQQ

Invesco QQQ Trust Series I

SPY

SPDR S&P 500 ETF Trust

VOO

Vanguard S&P 500 ETF

JEPI

JPMorgan Equity Premium...

TLT

iShares 20+ Year Treasury...

SCHD

Schwab US Dividend Equity ETF...

TSLY

YieldMax TSLA Option Income...

SMH

VanEck Semiconductor ETF

VTI

Vanguard Total Stock Market...

VGT

Vanguard Information...

Loading Articles...
Our Sites
  • VettaFi
  • Advisor Perspectives
  • ETF Trends
Tools
  • ETF Screener
  • Mutual Fund to ETF Converter
  • Head-To-Head ETF Comparison
  • ETF Country Exposure Tool
  • ETF Stock Exposure Tool
  • ETF Database Pro
More Tools
  • Financial Advisor & RIA Center
Explore ETFs
  • ETF News
  • ETF Category Reports
  • Premium Articles
  • Alphabetical Listing of ETFs
  • Browse ETFs by ETF Database Category
  • Browse ETFs by Index
  • Browse ETFs by Issuer
  • Compare ETFs
Information
  • Contact Us
  • Terms of Use and Privacy Policy
  • © 2023 VettaFi LLC. All rights reserved.

Advertisement

Is Your Portfolio Positioned With Enough Global Exposure?

ETF Education Channel

How to Allocate Commodities in Portfolios

Tom LydonApr 26, 2022
2022-04-26

A long-running debate in asset allocation circles is how much of a portfolio an investor should...

Core Strategies Channel

Why ETFs Experience Limit Up/Down Protections

Karrie GordonMay 13, 2022
2022-05-13

In a digital age where information moves in milliseconds and millions of participants can transact...

}
X