
The analysts here at ETF Database analyzed the search patterns of visitors to our site during the past week. Below, you’ll find our analyses of the top five trends. By analyzing these trends, we hope to unlock a better understanding of the investment themes trending on our site and in the market.
MLPs
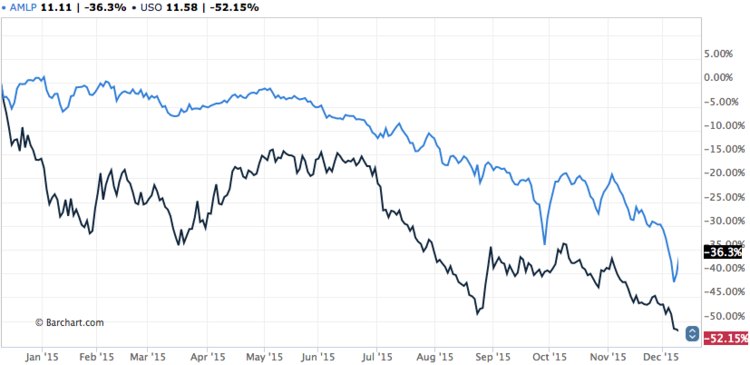
Both our MLP pages were trending this week: energy sector MLP, with traffic increasing 326%, and MLPs category, with traffic up 254% from a week earlier. MLP stands for Master Limited Partnership, which is a publicly traded partnership. Instead of trading shares of corporations, investors trade interests of partners. There are advantages to being an MLP vs. a corporation, such as that it has limited liability and provides liquidity to limited partners similarly to a corporation, while at the same time does not pay income taxes. MLPs can only be companies that receive more than 90% of their revenues from natural resources and real estate industries.
Most MLPs are in the energy sector, with some exposures to industrials, utilities and real estate. Typically, MLPs greatly depend on oil prices since these companies are in the business of transportation of natural resources such as oil and natural gas. These companies did not do too well these last few weeks because of the decline in price of one of the largest energy commodities – oil. The reason for this decline has to do with overproduction exceeding demand on a monthly basis. In particular, OPEC countries refused to cut oil production on Friday. More detailed analyses on oil prices is in the crude oil section of this article. Going forward, MLPs will continue to trend similarly to oil prices.
Airlines
The Airlines ETF List page has been trending; traffic is up 234% since last week. The only ETF that tracks airline companies is the U.S. Global Jets ETF (JETS ), which launched this year on April 30.
When comparing this ETF with United States Oil Fund (USO ) over the last few months, the picture is fairly clear; as oil prices decline, airlines generally soar. It’s no wonder investors are looking for ways to play the airline industry, since oil prices are reaching levels not seen in seven years.
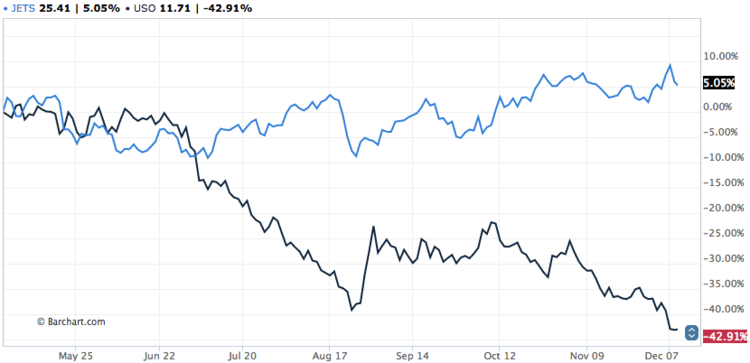
However, airline companies did fall in value as oil prices fell during the last couple of days, because airlines are reporting lower growth forecasts. For example, Southwest (the largest holding in the JETS ETF) announced on Tuesday that the average revenue per passenger flying 1 mile will be flat or down about 1% during this year’s quarterly earnings season compared to last year’s fourth quarter. This is a key metric in the airline industry, and might ripple throughout most airline companies as they compete for pricing.
Going into 2016, oil prices are expected to go lower, especially if the Fed raises rates on December 16. As a result, this will help airline companies, because a huge chunk of their expenses are oil and gas commodities. Although, after this initial decline in oil prices, we expect a rally once demand for oil increases later in 2016, while production decreases.
More on where oil prices are headed in the next section.
Crude Oil
Our crude oil page has been trending this week, with a 218% increase in traffic. A lot of other oil and gas pages on our website also were trending, with huge spikes in traffic.
Oil futures plunged on Monday and Tuesday. These were the lowest settlements in seven years. OPEC countries said on Friday they will maintain high production of crude oil even though there is oversupply in the market. OPEC countries are producing over their ceilings of 30 million bpd. Iran refused to consider a limit since it has been under western sanctions that will be lifted in 2016.
Basically, there’s oversupply of about 1 to 2 million bpd in the market, which is causing crude oil prices to drop. To add to the bad news, if interest rates increase during the next FOMC meeting on December 16, oil could go lower to about USD 35 a barrel. Small-sized U.S. shale drillers and Super Majors that have piled up large amounts of debt will be in trouble if rates rise.
Price of Crude Oil WTI January 2016 (CLF16):
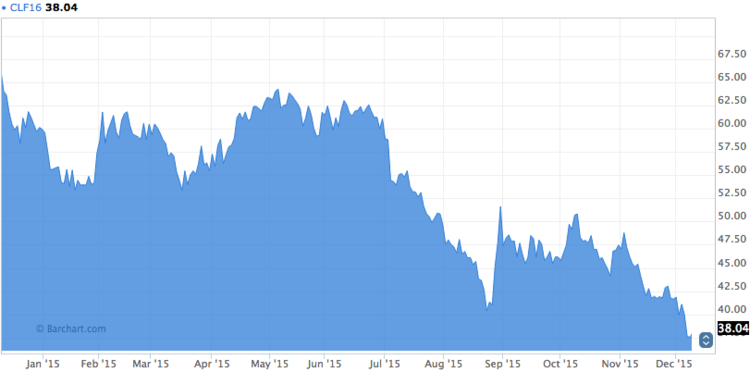
Going into 2016, non-OPEC production will contract. At the same time, daily demand is expected to increase by 1 million bpd. If supply decreases more than demand, crude oil is expected to rally in 2016. Although, it will get worse before it gets better.
VIX ETFs
Volatility ETFs are trending this week as people are looking for ways to play the current uncertainty in the markets. Our VIX ETF article had an increase in traffic of 126% since last week. VIX is a volatility index and is a measure of the expected annualized volatility of the S&P 500. It’s calculated as the square root of expected 30-day variance of return of the S&P 500 multiplied by 100, and then is annualized. As volatility and uncertainty in the markets rise, so does VIX. Unfortunately, investors can’t buy or sell VIX directly since it’s an index. However, they can trade options, futures or ETFs that track the index.

For an investor who wants an easy way to invest in the VIX, buying a VIX-based ETF or ETN might be a better solution. A VIX ETN such as the E-TRACS Daily Long-Short VIX ETN (XVIX ) will get an investor great exposure to the S&P 500 volatility. However, this mainly should be used as a hedging tool for your equity portfolio. All VIX ETFs and ETNs trend down over time because of rollover cost of options and futures. Having said that, if you are concerned your portfolio is headed for headwinds in the short term, exposures to volatility ETFs and ETNs are great hedging vehicles that decrease overall portfolio risk.
Euro
Our Euro currency page saw a hike of 89% more visitors this week. This had to do with the ECB’s decision to prolong the 60-billion-a-month euro QE program until March 2017. The news was disappointing since the ECB did not extend the amount of the buying program. This pushed equities lower and the euro higher on December 3 after the announcement. The euro kept its rally these last few days.
For investors looking to gain exposure to the euro, a good way to do this is through the CurrencyShares Euro Currency Trust (FXE ). On the other hand, the UltraShort Euro (EUO ) can be used to profit from a possible euro decline.
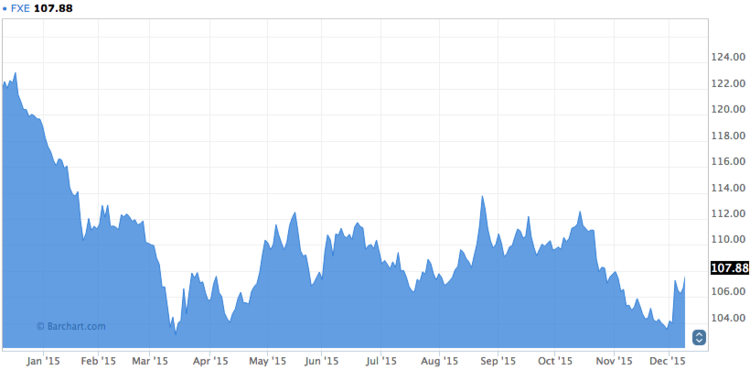
Given the recent rally in the euro, now is a great time to get short exposure to the euro. This is what is referred to as “selling on the pop.” We believe the euro eventually will hit parity with the U.S. dollar within the next year. This is because we expect more loose monetary policy (QE) going forward. The more Quantitative Easing there will be in the European economy, the lower the euro will go. Another reason for the bearish outlook has to do with Britain possibly leaving (Brexit) the European Union in 2017. Although this is two years away, investors will be making “bets” in 2016 on the outcome of the referendum.
The Bottom Line
The biggest trends this week had to do with oil, whether directly or indirectly. Crude oil futures contracts are trading at the lowest levels since 2008. This affects many industries – some positively, such as the airline industry, and some negatively, such as the oil-producing and MLP industries. Other important trends this week included the euro, which trended higher this week, and the S&P 500 Volatility Index (VIX). As discussed above, exposure to the VIX through ETFs and ETNs is a great way to hedge investors’ equity portions of their portfolios.
By analyzing how you, our valued readers, search our property each week, we hope to uncover important trends that will help you understand how the market is behaving so you can fine-tune your investment strategy. At the end of the week, we’ll share these trends, giving you better insight into the relevant market events that will allow you to make more valuable decisions for your portfolio.

