
The bullish momentum seen in February appears to have spilled over nicely thus far into March, but uncertainty lurks underneath the surface as made clear by investor positioning in defensive assets.
A closer look at ETF flows from the prior month reveals some key trends that are easily overlooked if we only consider the performance of the major averages.
Where Did the Money Go in February?
Investors took advantage of choppy conditions last month by increasing their exposure to defensive assets. Broadly speaking, equities saw outflows while bonds and commodities managed to attract money in February, bringing hope to some beaten down names and profit-taking pressures onto others.
The top gainers in terms of assets for the month of February were concentrated in low-risk corners of the market. Continued uncertainty over China’s growth prospects and prolonged weakness in Europe remain big question marks for investors to swallow amid a shifting Fed policy at home.
Recession talks, mixed earnings, and a generally muted growth outlook prompted inflows for risk-off names:
Some of the biggest losers for the month included:
- Biotechnology (FBT ).
- Japan Hedged Equity (DXJ ).
- Financial Select SPDR (XLF ).
- MSCI Eurozone (EZU ).
The key takeaway from February’s flows data is that investors are playing defense in light of fragile macro conditions.
What’s the Bigger Trend?
Looking at one month of flows data and attempting to draw meaningful conclusions from it is like trying to describe a movie to someone using only a single frame of reference. It’s not going to work well, let alone consistently.
Because fund flows data tend to be more erratic in terms of month-to-month volatility, for simplicity’s sake, it may be helpful to consider the bigger trend at hand by looking at returns over a longer time frame.
Consider the heatmap below, courtesy of FinViz, which spans the ETF universe over the trailing one-year period (returns as of 3/8/16):
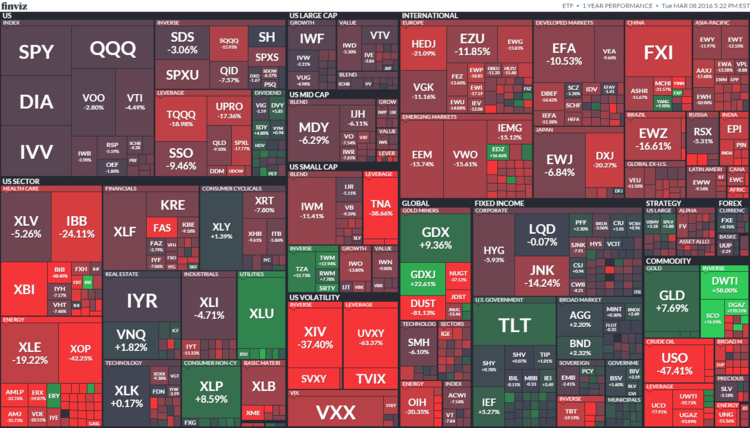
The key takeaways here are as follows:
- Utilities (XLU ) have been outperforming for a while, so February’s spike in flows isn’t anything new trendwise.
- Consumer staples (XLP ) is another market leader with a defensive profile on the sector level.
- Gold (GLD ) and related miners (GLD ) and (GDXJ ) have been running higher all year on growing safe haven demand and dirt cheap valuations, respectively.
- Long-term Treasuries (TLT ) are another name that was also green in February in terms of flows.
Ultimately, many of the highlights from February’s flows data have seen trends that are already in play, so to speak. The long-term picture, highlighted via the heatmap, and short-term direction, highlighted by the February flows data, both point to a bullish trend for the ETFs highlighted above.
Ways to Play
Investors have a plethora of options when it comes to choosing a best fit ETF for their objective. For starters, there are more than a few alternatives available when it comes to accessing each and every one of the assets mentioned:
When looking at the latest quarterly earnings results, investors may want to focus on the two strongest corners of the market:
Given that February flows point to some trends that have already been in play, it may be prudent to approach these “continuation plays” with caution. For starters, consider scaling into the aforementioned securities, whether it’s in defensive sectors or gold-related ETFs, rather than going all in.
The Bottom Line
While the uptrends at hand are likely to persist, this fragile environment is not conducive to making outsized bets in either direction. Remember that flows data is sometimes interpreted as a contrarian sign, meaning that the recent flight to safety in the market could be a sign that some safe-haven assets may actually be topping out soon when we consider they have already outperformed for the past year.
No matter the case, keep in mind that price is the best indicator.
Follow me @SBojinov

