
ETFdb.com analyzes the search patterns of our visitors each week. By sharing these trends with our readers, we hope to provide insights into what the financial world is concerned about and how to position your portfolio.
The main themes this week revolved around Janet Yellen’s speech and positive market outlooks. However, investors were still researching inverse ETFs, which shows that some may believe the equity market is overhyping the dovish tone of the Chair of the Board of Governors of the Fed.
ETFs and K-1 Tax Reporting
This week’s leading ETF search, which saw an increase of 30% over the week, is the ETF and K-1s tax reporting page. While there are no ETFs mentioned on this page, there are several ETFs which are indirectly related to it, namely ETFs that deal in commodities, currencies or other strategies, such as (BNO ) and (UUP ).
ETFs by their very nature are unique in the investing world. They are not the same as stocks, nor are they mutual funds; they are a hybrid between these two classes of investment. Since they are a hybrid type of investment, they have more rules associated with them, especially when it comes to taxes. Several ETFs, especially commodity ETFs, are actually a form of limited partnerships. Thus when it comes to taxes they are treated like a partnership and investors will receive a schedule K-1 indicating profits and losses associated with the ETF. It is important to note that these forms of ETFs may have a taxable event even though the investment has not been sold. This is because as an investor you are part owner of the company and may have an income event. Additionally, you should be aware that these schedule K-1 forms are required to be sent to you by the issuer no later than March 15 of the tax year.
British Pound
Our British pound ETF page has seen a 27% increase in viewership. You may recall that at the beginning of March we had a similar uptick in the British pound. The top ETF related to the British pound, the CurrencyShares British Pound Ster ETF (FXB ), seems to have found its solid support region at the 138 level, as it bounced from that point several times in the last few months. For this past week alone, FXB showed about a 2% rally. Even so, his ETF is still below both its 100-day and 200-day moving averages.
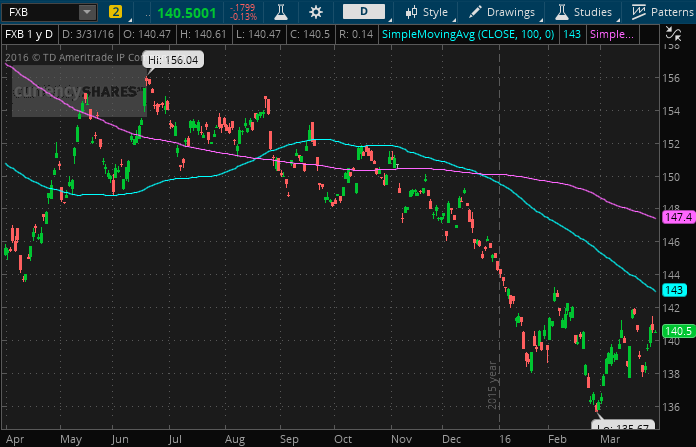
The bullishness related to the British pound seems to revolve around Janet Yellen’s speech on March 29. Addressing a group in New York, Yellen indicated that the Federal Reserve is willing to take a more dovish stance on interest rates, especially given weakness in overseas markets. She also mentioned that the Fed has more ways to stimulate growth, such as more QE. Clearly, for investors who play currency markets, as the Federal Reserve slows its rate increases, overseas currencies become more appealing. Thus, unless the Federal Reserve changes position drastically in the next few months, the U.S. dollar should not appreciate in value, especially against those that did well in the last month, such as the British pound.
Additionally, U.K. Q4 GDP released today was 2.1% annualized, which was better than the expected 1.9%. This gave an additional boost to the British pound vs. the U.S. dollar.
3 SMA ETF Trading Strategies
Our page regarding how to trade ETFs using moving averages registered a modest 22% increase in traffic this week. Obviously, just as any equity is influenced by moving averages, so are ETFs.
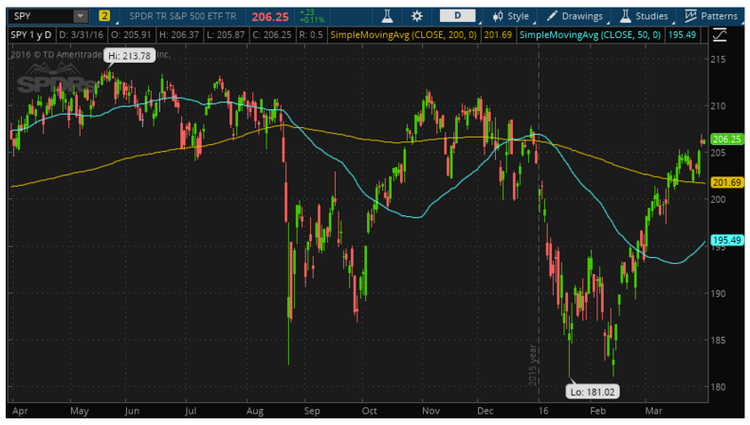
For example, let’s examine the largest ETF in the market: the SPDR S&P 500 (SPY ). The latest golden cross was on January 11 of this year for SPY. This is when the 50-day SMA (blue line) crossed below the 200-day SMA (yellow line), which was a bearish crossover.
On February 23, the 10-day SMA (blue line) crossed the 30-day SMA (green line), which was a bullish sign in SPY. Traders who wished to take advantage of the rally in this bear market made roughly 5% in a one-month period.
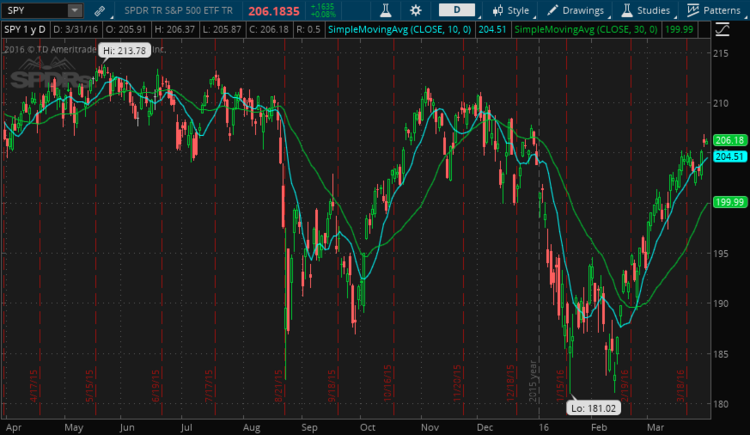
Finally, looking at the five, 10, 20 crossover on the SPY chart, one can see that only on February 24 did all the SMA’s begin moving in the same upward direction after the 10-day SMA (blue line) crossed the 20-day SMA (green line). According to this indicator, we saw some trouble right around the time of Janet Yellen’s talk on Tuesday as the five-day SMA (yellow line) crossed below the 10-day SMA (blue line), but the very next day the five-day SMA crossed right back. Right now the trend seems to indicate a bullish sign.
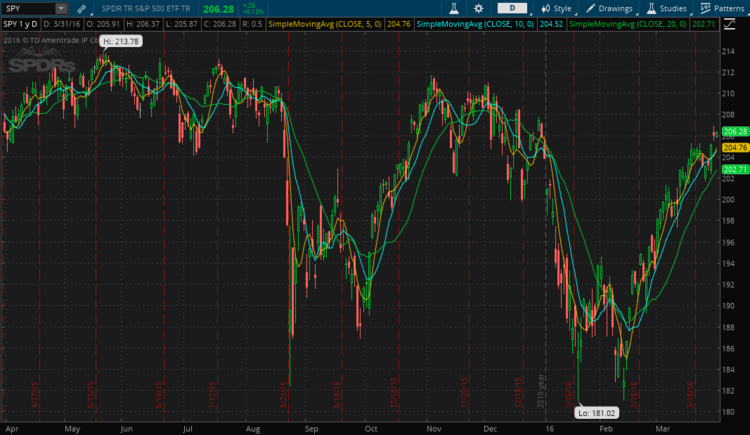
While technical analysis is always a helpful tool to a trader, it should be remembered that simple moving averages are just one tool out of many and cannot be looked at in isolation. Investors should look at other technical and fundamental indicators before making any investment decisions.
Inverse Equity
Earlier this week, our inverse equity ETFs page indicated some increased interest, showing a 12% increase in traffic. While there are many possibilities to play inverse equity ETFs, one of the primary ways is the Short S&P 500 ETF (SH ). This ETF reached its one-year low yesterday (March 30). This is, of course, due to the recent market rally after one of the worst beginning-of-the-year market performances in years.
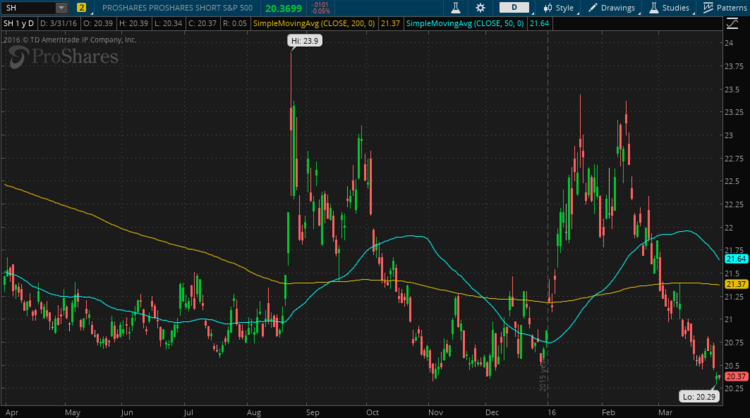
The interest in inverse equity ETFs seems to have some relationship to Yellen’s speech earlier this week. Prior to her speech, several Fed members were more hawkish in their comments about interest rates. Because of this, the stock market did have some jitters interjected into trading, with the stock market being down in the latter part of last week. The increased interest in the inverse equities appears to have been related to these previous comments from Fed members and was quickly dispersed after Yellen spoke on Tuesday.
Lowest Expense Ratios
Our ETF webpage ranking the various expense ratios of ETFs seem to have garnered some interest this past week, with viewership rising 5%. Our page shows the top 100 ETFs with the lowest expense ratios. The Schwab U.S. Broad Market ETF (SCHB ) from Charles Schwab comes in with the lowest expense ratio at 0.03%. In fact, looking at this list, it is clear that both Charles Schwab and Vanguard are the leading companies when it comes to maintaining low expense ratios for ETFs. Some other issuers have cheap ETFs as well, including iShares and SPDR.
As an investor or investment manager, it may be prudent to examine the different expense ratios to see which issuer has lower fees to maximize your returns.
The Bottom Line
This week we didn’t see dramatic increases in traffic to our ETF pages. This is due to the Easter long weekend since people are not as active online. However, it is clear from the actual performances of FXB, SH, and SPY that the market was caught somewhat off guard by Yellen’s renewed assurance that the Federal Reserve still has resources at its disposal to stimulate the economy. Although, investors should still be cautious since there was much volatility in the markets not long ago. Further, the potential remains for a large correction in the not so distant future.
By analyzing how you, our valued readers, search our property each week, we hope to uncover important trends that will help you understand how the market is behaving so you can fine tune your investment strategy. At the end of the week, we’ll share these trends, giving you better insight into the relevant market events that will allow you to make more valuable decisions for your portfolio.

