
ETFdb.com analyzes the search patterns of our visitors each week. By sharing these trends with our readers, we hope to provide insights into what the financial world is concerned about and how to position your portfolio.
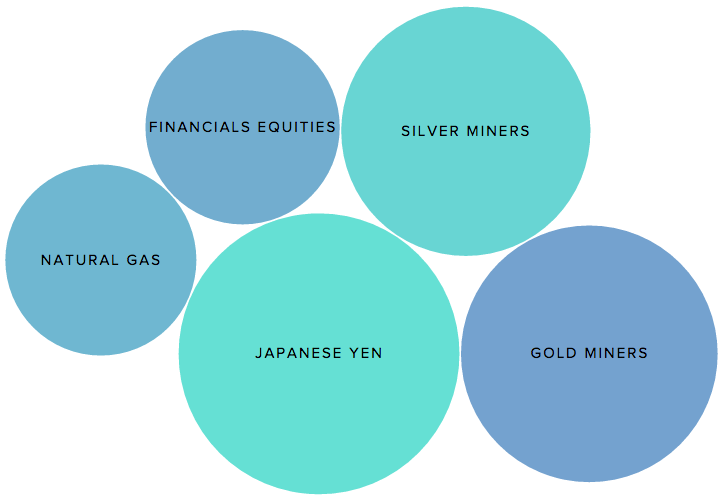
The global equity markets have continued to grow this week, but our weekly top-visited ETF pages show investors’ jitters are on the rise, with safe-haven assets in great demand. How else can we explain the Japanese yen, gold, and silver topping our list by a significant margin this week? It should also be noted that the Japanese yen is on this list for the second consecutive week.
The Japanese Yen: The Sky's the Limit
On Monday, the Japanese yen reached a fresh 17-month high against the U.S. dollar at 107.63 yen for $1, prompting pundits of all stripes to muse on the currency’s climb and bewilderedly attempt to explain it. The currency’s strength is neither driven by fundamentals nor by its safe-haven status. Japan’s interest rates are situated at rock-bottom levels, while global financial markets have been calm lately. Some have argued the yen strengthened because of the relative weakness of the dollar, but others pointed to the yen being used as a funding currency because of its cheapness.
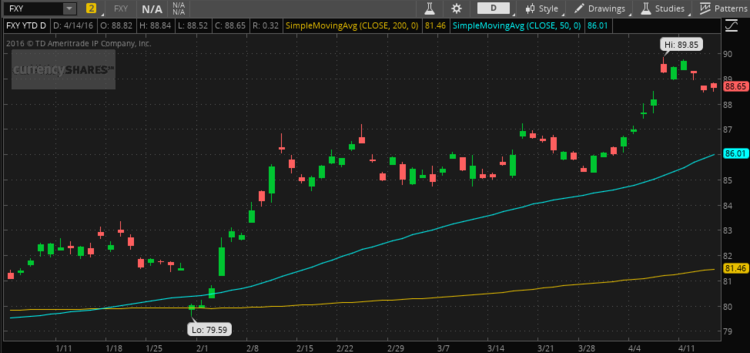
Whatever the reason for the yen’s ascent, the move has surely attracted many visitors to our Japanese yen ETF page. Viewership increased this week by a staggering 300% compared to the previous week. It is worth noting that last week the yen took the second spot in our list with a 35% increase in viewership, showing rising interest in the currency. The yen has been the best performing among its Asian peers since the beginning of the year as seen by the Guggenheim CurrencyShares Japanese yen Trust ETF (FXY ), which rose 9.9% YTD.
There are fears that the Japanese central bank is running out of options to drive down the value of the yen, having already deployed a huge QE program and setting negative interest rates on deposits. The market may have grown tired of seeing the central bank consistently missing its inflation and growth targets, and has been reluctant to react to devaluation moves. Still, the yen weakened somewhat to 109.09 against the U.S. dollar following comments by Chief Cabinet Secretary Yoshihide Suga that intervening to halt one-sided currency moves was not against the Group of 20 agreement to avoid competitive currency devaluation. The comments suggest that Japan may soon deploy measures specifically targeted at depreciating the yen.
Gold Miners: Glittering Like It’s ‘09
It has been a while since any firm digging stuff out of the ground heard good news from the public markets. Although many of these companies are still struggling to do so, those producing gold may now breathe easy. The price of gold has risen nearly 17% since the beginning of the year, likely turning a corner.
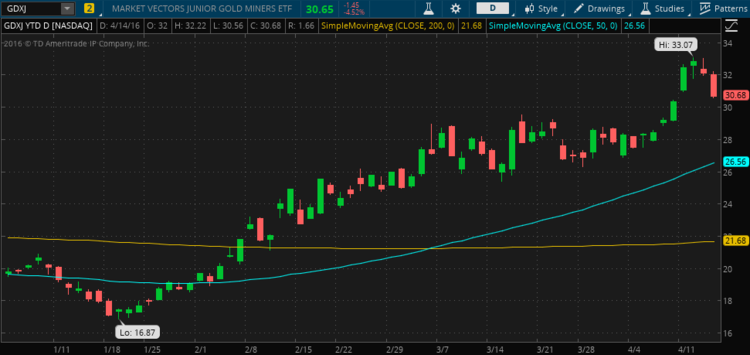
Gold’s outperformance has inevitably attracted interest from investors and from our readers this week. Viewership of our gold miners ETFs page increased about 97% this week compared to last week. The main reason for gold miners’ popularity was their outperformance relative to the spot price of gold, with some of ETFs posting double-digit gains over the last week alone. For instance, Market Vectors Gold Miners ETF (GDX ), a fund consisting of industry majors such as Barrick Gold Corp. (ABX) and Newmont Mining Corp. (NEM), was up roughly 6% since Friday last week and has risen an impressive 56% since the beginning of the year. ETFs containing junior miners have gained even more, with the Market Vectors Junior Gold Miners ETF (GDXJ ) jumping more than 5% since last Friday and 60% year to date.
Silver Miners: In the Shadow of Its Shinier Sister
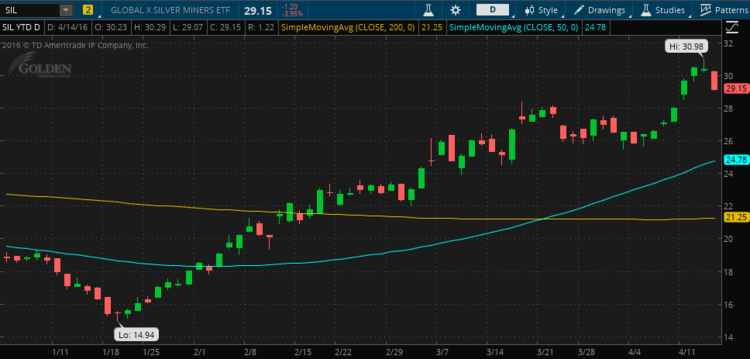
Historically, the spot price of silver has mostly moved in tandem with gold prices. So the fact that silver miners are positioned right behind their gold counterparts in our popularity contest should not raise any eyebrows. Our page tracking silver miners ETFs saw its traffic increase 76% this week compared to last week. This was mostly due to the outstanding performance of these ETFs, which posted similar returns as gold mining ETFs. The Silver Miners ETF (SIL ) has spiked nearly 9% over the past week alone, extending year-to-date gains to as much as 58%.
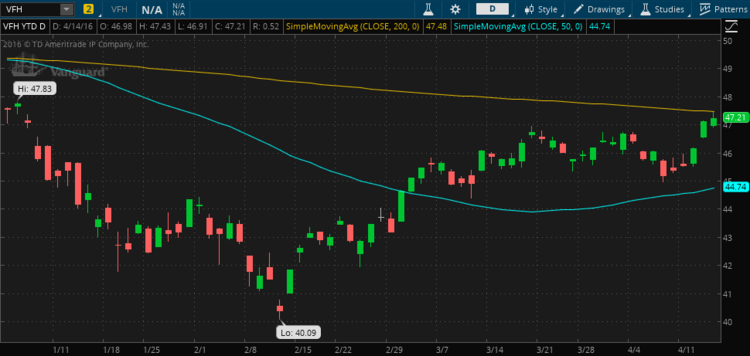
Financials Equities: Worries Mount
Viewership of our financials equities ETFs page spiked by some 60% in the past week. Financial and banking stocks have had a good run since the global financial and economic crisis took them down about eight years ago. But lately, financial stocks have given investors reasons to worry about their performance, considering a tougher regulatory environment, low interest rates hurting profitability, and difficulties faced by heavily indebted shale gas players.
The year-to-date performance of many ETFs tracking the industry remains in negative territory, with several down by as much as 10%. However, last week saw a small rebound as several banking giants, including JPMorgan Chase (JPM) and Bank of New York Mellon (BK), posted strong financial results for the last quarter. The Vanguard Financials ETF (VFH ), a fund containing banking giants such as Bank of America (BAC) and Citigroup (C), rose over 1% this week, trimming year-to-date losses to 2.2%.
Natural Gas: Dreaming of Recovery
Natural Gas ETFs have been badly hit over the past few years as a large swath of commodities slumped to lows not seen since the Great Recession. Even the year-to-date performance of many natural gas ETFs remains deep in the red. But this week, some positive news combined with a small rebound has promoted the belief that natural gas may have found the light at the end of the tunnel and could stage a recovery over the next several months.
These developments garnered reader interest this week; the number of visitors to our natural gas ETFs page soared by 58% compared to last week. Natural gas futures rose impressively this week on expectations of a warm summer, boosting demand for air conditioning. This was coupled with a decline in shale production. U.S. Energy Department forecasts supply to shrink by 1.1% in May compared to April.
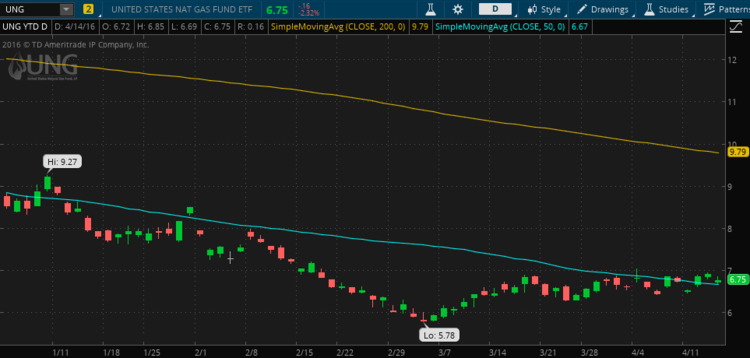
Although still down 22% since the start of the year, the United States Natural Gas Fund (UNG ), jumped 2.5% from the beginning of this week till Wednesday. Considering the commodity’s very low price, a recovery may be indeed under way.
The Bottom Line
Without an obvious reason, safe-haven ETFs and assets have been popular this week for their outperformance. Three of them topped our list: the Japanese yen, gold miners, and silver miners ETFs. And considering that financial stocks were also in the top, but for their relative underperformance, investors could rightly begin to worry whether something is brewing in the global equity markets. Finally, natural gas ETFs also attracted visitors due to the possibility of a recovery in the commodity.
By analyzing how you, our valued readers, search our property each week, we hope to uncover important trends that will help you understand how the market is behaving so you can fine-tune your investment strategy. At the end of the week, we’ll share these trends, giving you better insight into the relevant market events that will allow you to make more valuable decisions for your portfolio.

