This week, investors were preoccupied with Russia, as the country’s equities fell dramatically after the relations with countries in the West, including the U.S., deteriorated.
First in the list, however, is Barclays Capital, as the asset management arm of the British bank said it would shut down a host of exchange-traded notes (ETNs). Russia is second in the list followed by crude oil, which has been on a tear lately thanks to dropping stockpiles in the U.S. Leveraged ETFs and biotechnology stocks close the list.
Check our previous trends edition at Trending: Soybean Prices Whipsaw on Trade War Fears.
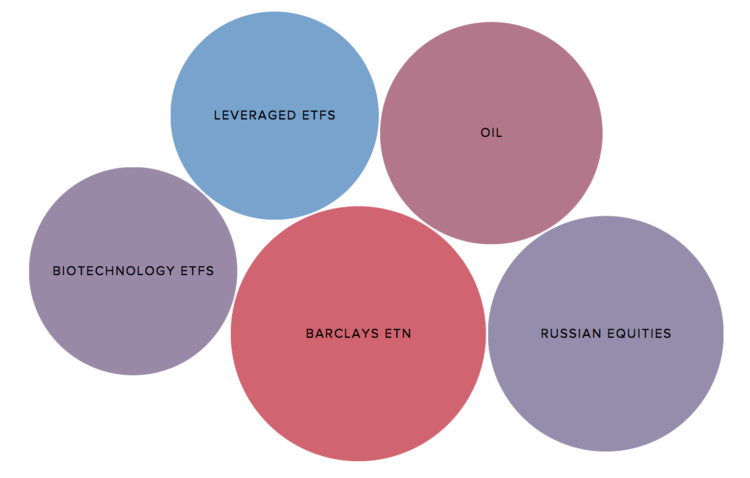
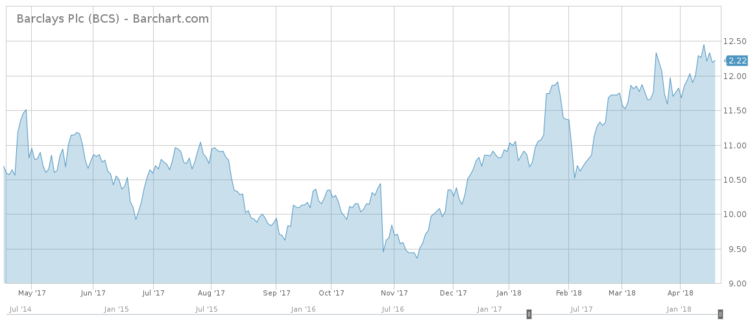
Barclays to Close $1.2 Billion Worth of ETNs
Barclays Capital has trended the most this week, seeing its viewership rise 331%. That’s hardly surprising; Barclays announced plans to shut 50 ETNs with around $1.2 billion worth of assets in order to improve focus on other ETNs that are more lucrative. Only 6 of the ETNs expected to close have assets of more than $50 million.
Among the ETNs that will be eliminated are iPath EUR/USD Exchange Rate ETN (ERO ), iPath GBP/USD Exchange Rate ETN (GBB ) and iPath MSCI India Index ETN (INP ). In addition, Barclays plans to close a host of commodity ETNs, including some tracking aluminum, cocoa and coffee.
Many investors in these ETNs are not prepared for the upcoming delisting, judged from the fact that they are still invested in the instruments. Failure to withdraw the cash would leave investors with securities that are difficult to trade. There are several choices, though: hold the ETNs until maturity, sell them in the over-the-counter markets or redeem them with Barclays for cash or new securities.
The ETN market has largely failed to gain traction with the wider investor base as its cousin, the ETF, did. The entire ETN market in the U.S. is $23 billion, paling in comparison with the ETF market, which is worth as much as $3 trillion.
ETNs are debt obligations underwritten by the issuing entity, while ETFs are pools of assets.
Russian Equities in Dire Straits as Relations With the West Worsening
Traffic to Russian equities has risen 121% this week, as investors gauged the impact of economic sanctions against a circle of Russian businessmen close to the Kremlin. Rusal, the aluminum giant controlled by billionaire Oleg Deripaska, was prevented from doing business with the U.S. and other Western countries. As a result, the company’s stock plunged more than 50% on the day of the announcement.
The Russian government is mulling swift actions of support for the companies hit by sanctions, although it is yet unclear what steps it would take.
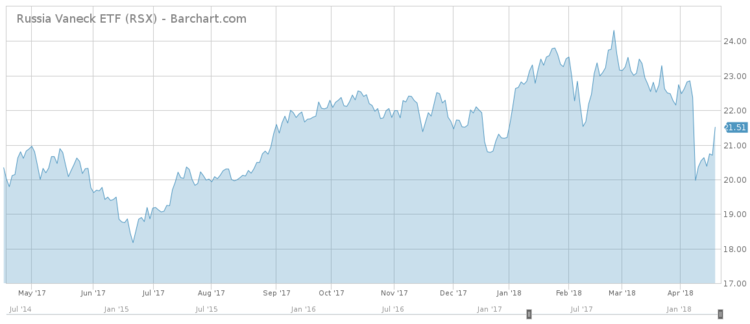
As such, investor fears started to rise that other companies headed by businessmen close to the government will be blacklisted as well. VanEck Vectors Russia (RSX ) is down more than 6% over the past month.
In the past five days, (RSX ) has surged more than 4% after U.S. President Donald Trump rejected imposing a fresh round of sanctions against Russia, despite United Nations Ambassador Nikki Haley, a fierce Russia critic, saying new sanctions were forthcoming. The Trump administration said the U.S. would consider additional measures depending on Russia’s future behavior.
Sign up for ETFdb.com Pro and get access to real-time ratings on over 1,900 U.S. listed ETFs.
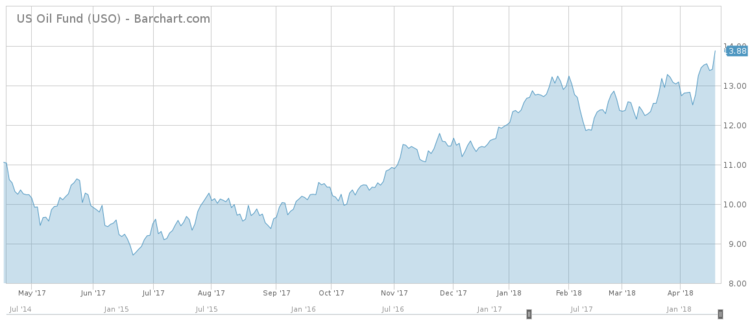
Oil Jumped on Higher Stockpiles, Saudi Arabia Policy
Crude oil has continued its advance this week as the Energy Information Administration delivered another bullish inventory report. As a result of the upbeat news, traffic to crude has increased by 96% this week.
Crude oil inventories dropped 1.1 million barrels for the week ended April 13 to 427 million, nearly 20% below the year-ago level. Gasoline inventories also dropped, by 3 million barrels, after a small rise last week, while distillates registered the largest drawback of 3.1 million barrels.
Demand for crude is rising at a time when supplies are threatened by a worsening military conflict in Syria. Adding to the bullish picture, Saudi Arabia reportedly indicated that it would like to see oil prices closer to $100 per barrel from around $68 for U.S. West Texas Intermediate now. The news is an indication that Saudi Arabia will not rush to scrap a deal with Russia to cut supplies even as the agreed price target is within sight.
United States Oil (USO ) has surged nearly 3% over the past five days, extending year-to-date gains to 15%.
For a deeper analysis on individual ETF investments such as (USO ) or (RSX ), use our ETF Analyzer tool. You can select ETFs by Category or Type as well as add individual ticker symbols to compare performance, expenses and dividend yield, among other metrics.
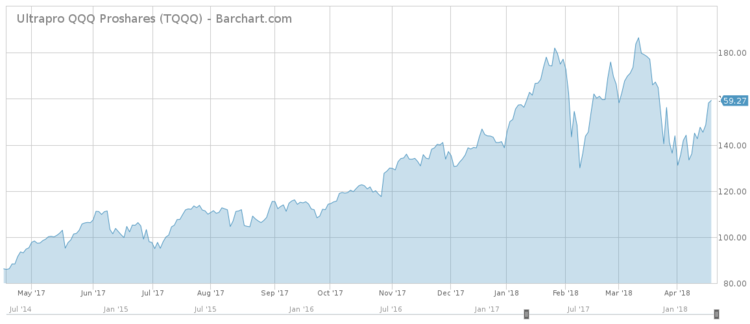
Leveraged ETFs
Leveraged ETFs have taken the fourth spot in the list this week with an 81% rise in viewership.
ETFs that employ leverage are inherently riskier than their simpler counterparts because many leveraged ETFs fail to perfectly track the leveraged performance of their underlying instrument. Beta-slippage, roll yield, tracking errors and management fees are a few reasons why that happens. The investor can calculate the cost only for management fees, with other features being variable. The risk is compounded if the leveraged ETF is inverse, meaning that it rises when its underlying assets falls.
There are 79 leveraged ETFs (i.e. 3 times the leverage) on the ETF Database database, with ProShares UltraPro (TQQQ ) and Direxion Daily Financial Bull 3X Shares (FAS ) the largest by assets under management. (TQQQ ) has $3.8 billion in assets under management, while (FAS ) has a little more than $2 billion.
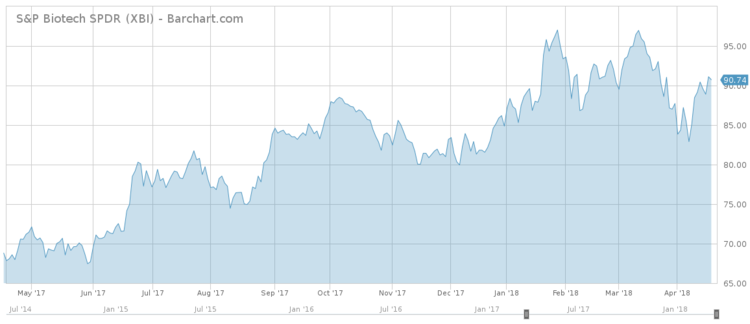
Biotechnology ETFs
Biotechnology ETFs were last in the list this week, sporting an increase in viewership of 56%. The biotechnology sector has largely disappointed this year, particularly blue-chip stocks. iShares Nasdaq Biotechnology (IBB ) is up just 0.5% since the start of the year and 11% for the past 12 months, while the broad market (SPY ) edged up by more than 1% and 15% over the same time periods, respectively.
Of note, however, is that small-cap biotechnology stocks outperformed their larger peers by a long shot. SPDR S&P Biotech (XBI ) is up 4% since the start of the year and 33% in the past 12 months.
Going forward, (IBB ) may outperform as the earnings season is expected to be strong for blue-chip companies and investors are on the hunt for value plays.
The Bottom Line
Barclays is closing more than $1.2 billion worth of ETNs, but investors are seemingly apathetic to the move and still have their assets tied into the instruments. Meanwhile, Russian equities have received some respite after U.S. President Donald Trump backtracked on imposing additional economic sanctions. Oil is on a tear as demand is continuing to rise, while Saudi Arabia signaled that it wants to see prices closer to $100 per barrel. Leveraged ETFs trended as many of the exotic instruments are becoming increasingly riskier. Lastly, biotechnology ETFs largely trailed the market but may outperform in the coming period as investors search for value plays.
By analyzing how you, our valued readers, search our property each week, we hope to uncover important trends that will help you understand how the market is behaving so you can fine-tune your investment strategy. At the end of the week, we’ll share these trends, giving you better insight into the relevant market events that will allow you to make more valuable decisions for your portfolio.

