
News
To help investors keep up with the markets, we present our ETF Scorecard. The Scorecard takes a step back and looks at how various asset classes across the globe are performing. The weekly performance is from last Friday’s open to this week’s Thursday close.
- Global metal markets were shaken this week after the U.S. imposed economic sanctions on Russian aluminum producer Rusal, with a Germany industry lobby group warning that the move may cause plant closures across Europe and lead to aluminum supply shortages. There had also been fears that additional sanctions against Russia were forthcoming, but U.S. President Donald Trump rejected a new set of penalties for now.
- U.S. consumer sentiment declined to 97.8 in April, after reaching a record high of 101.4 last month. Economists had expected a reading of 101 this month.
- U.S. retail sales came in stronger than expected, rising 0.6% in April compared to the prior month. Consensus estimates stood at 0.4% growth. In March, retail sales fell 0.1%. Core sales, i.e. stripping the volatile automobile sales, were in line with estimates at 0.2% growth.
- Chinese GDP is remarkably stable, rising 6.8% in the first quarter of 2018, in line with expectations and unchanged compared to the previous quarter.
- Britain’s unemployment rate dropped to 4.2% in February from 4.3% in the prior month as the economy added 11,600 jobs in March.
- Germany’s ZEW economic sentiment unexpectedly plunged to negative 8.2 in April, indicating pessimism has increased in the current month. In the prior month, the index came in at positive 5.1.
- The U.S. residential construction business continued to be strong in March, with housing starts rising to 1.31 million from 1.23 million in the prior month. Building permits also rose consistently, from 1.29 million to 1.35 million in March.
- Britain’s CPI dropped to 2.5% in March from 2.7% in the prior month, as the British pound appreciated of late due to an increasing possibility of a softer Brexit.
- U.S. crude oil inventories dropped by 1.1 million barrels for the week ended April 13 to 427 million, nearly 20% below the year-ago level. Gasoline and distillates inventories dropped more abruptly, by 3 million and 3.1 million barrels, respectively.
- Unemployment claims came in at 232,000 for the week ended April 14, a little higher than the estimate but lower by 1,000 compared to the prior week.
Risk Appetite Review
- Markets have been less volatile in the past week, although some corners of the market experienced brutal swings.
- High Beta (SPHB ) is the only faller from the pack with a drop of 0.09%, while Low Volatility (SPLV ) is the best performer with a rise of nearly 1%.
- The broad market (SPY ) was also up 0.55%.
- Sign up for ETFdb.com Pro and get access to real-time ratings on over 1,900 U.S.-listed ETFs.
Content continues below advertisement

Major Index Review
- Technology stocks (QQQ ) are the best performers for the second consecutive week, finally halting a losing streak connected to Facebook’s data breach issue and Donald Trump’s warnings against Amazon. (QQQ ) was up 1.17% in the past five days.
- Emerging markets (EEM ) were the worst performers both for the week and the rolling month, down 0.31% and 2.51%, respectively. China and Russia have weighed negatively on the index, while Brazil offset some of the losses.
- For the rolling month, European and Asia Pacific equities (EFA ) posted the strongest performance, advancing 2.15%.
- To see how these indices performed a week before last, check out ETF Scorecard: April 13 Edition.

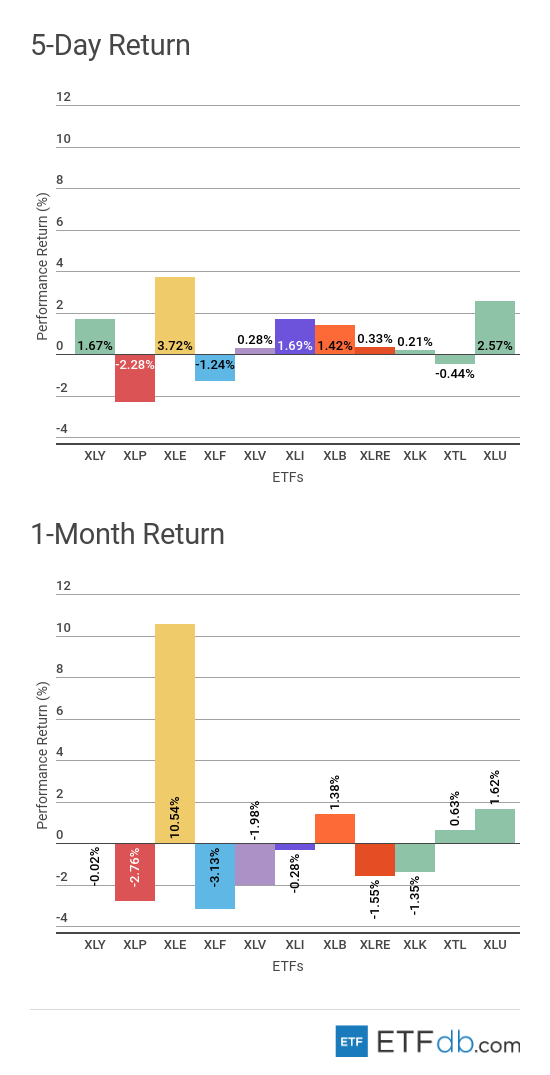
Sectors Review
- Sectors were rather mixed.
- Incessantly rising oil prices have made the energy sector (XLE ) the best performer both for the week and the rolling month by far. (XLE ) is up 3.72% and 10.54%, respectively.
- Meanwhile, consumer staples (XLP ) posted the weakest performance for the week, dropping 2.28%.
- For the rolling month, the financial sector was hit the most, with (XLF ) declining 3.13%.
Foreign Equity Review
- Foreign equities were mixed.
- Russia (RSX ) was the best performer for the week with an advance of 3.64% as the U.S. administration rejected imposing additional economic sanctions on the country. Still, (RSX ) remains the worst performer for the rolling month with a fall of 5.7%.
- The Chinese stock market (FXI ) recorded the weakest performance for the week, tumbling more than 2%.
- British equities (EWU ) reported an impressive monthly performance as hopes for a softer Brexit are increasing. (EWU ) is up 5.1% in the past 30 days.
- To find out more about ETFs exposed to particular countries, check out our ETF Country Exposure tool. Select a particular country from a world map and get a list of all ETFs tracking your pick.

Commodities Review
- Commodities were mixed.
- Silver (SLV ) was surprisingly the best performer for the week, advancing nearly 4%.
- Natural gas (UNG ) again fell the most from the commodity pack as demand remains subdued. (UNG ) is also the only faller for the rolling month, down 0.67%.
- For the rolling month, oil (USO ) remains the best performer with a solid rise of nearly 8%, as the commodity was boosted by strong demand in the U.S. and Saudi Arabia’s signal that it wanted prices close to $100 per barrel.
- Use our Head-to-Head Comparison tool to compare two ETFs such as (UNG ) and (SLV ) on a variety of criteria such as performance, AUM, trading volume and expenses.

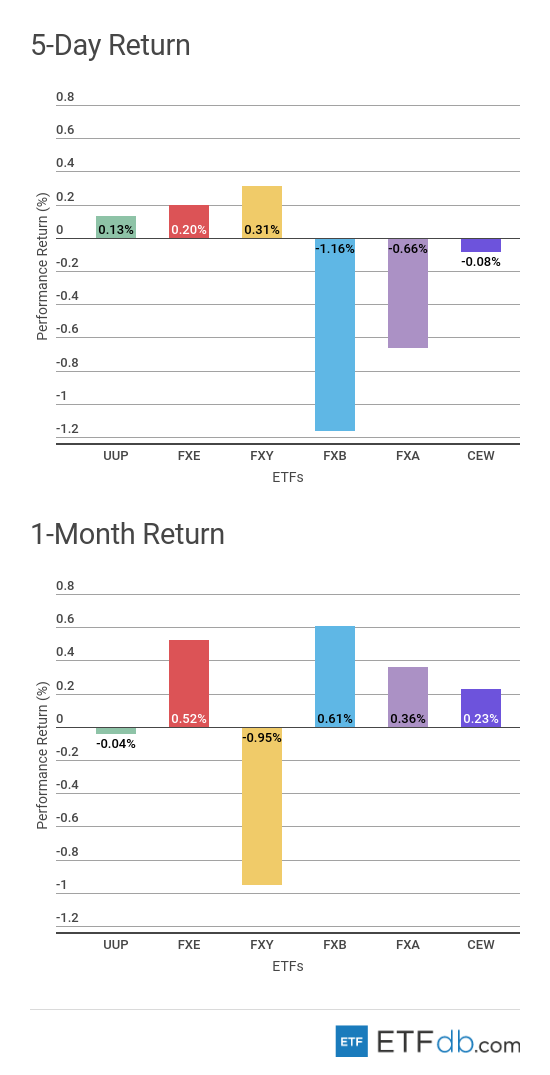
Currency Review
- The Japanese yen (FXY ) was the strongest currency this week, although it rose tepidly by 0.31%. However, the yen stays the worst performer for the past 30 days, down 0.95%.
- The British pound (FXB ), meanwhile, was the worst performer for the week, down 1.16%, but remained the best performer for the month, up 0.61%.
For more ETF analysis, make sure to sign up for our free ETF newsletter.
Disclosure: No positions at time of writing.

