
To help investors keep up with the markets, we present our ETF Scorecard. The Scorecard takes a step back and looks at how various asset classes across the globe are performing. The weekly performance is from last Friday’s open to this week’s Thursday close.
- This week was rich in macroeconomic events with Bank of Japan and the Federal Reserve unveiling their monetary policy frameworks.
- Bank of Japan (BoJ) kept interest rates steady and removed the timeframe for achieving its 2% inflation goal. BoJ kept short-term interest rates at minus 0.1% and the 10-year bond yield at around zero percent, in a widely anticipated move. The bank also forecasted inflation of 1.8% for the next fiscal year, indicating a view that a strong economy will lead to pricing pressures.
- In another widely anticipated move, the U.S. Federal Reserve held interest rates steady at within the range of 1.5% to 1.75% and noted that inflation was rising. The U.S. central bank also suggested it is not worried about a rapid increase in price levels or a slowdown in economic activity that could change the pace of its rate increases. There are overwhelming expectations in the market that the Fed will raise rates at its next meeting in June.
- U.S. GDP has advanced 2.3% in the first quarter, beating analysts’ expectations of 2% growth.
- U.K. economic activity has registered a notable slowdown in the first quarter, with preliminary data indicating GDP rose a meager 0.1% compared to the previous quarter. Analysts expected GDP growth of 0.3%.
- U.S. PMI manufacturing index for April was in line with consensus estimates of 56.5. The figure represented an advance from 55.6 in the prior month.
- The more important ISM manufacturing index dropped to 57.3 in April from 59.3 in the prior month. Analysts had expected a correction to 58.6.
- The U.S. jobs market continues to improve, judged by the ADP report, which may diverge from the official data. As many as 204,000 jobs were added in April, higher than analysts’ expectations of 190,000.
- Crude oil inventories rose by 6.2 million barrels for the week ended April 27, marking the second consecutive weekly increase.
- Inflation in the Eurozone is continuing to fall, with headline CPI growing by 1.2% in April year-over-year. Core CPI, meanwhile, dropped more alarmingly to 0.7% from 1%, disappointing analysts, who expected a rise of 0.9%.
- U.S. unemployment claims rose to 211,000 in the April 28 week, hovering near all-time lows. Economists had estimated claims to rise to 225,000.
Risk Appetite Review
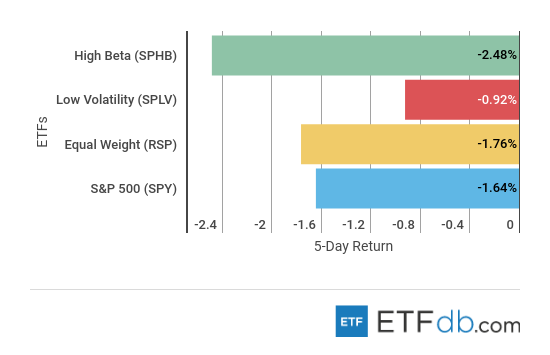
- Markets continued to fall this week.
- High Beta (SPHB ) is again the worst performer from the bunch, declining 2.48%, as investors shunned riskier assets.
- Unsurprisingly, low volatility (SPLV ) posted the best performance this week, falling by just 0.92%.
- The broad market (SPY ) has lost 1.64% of its value, amid a hawkish Federal Reserve and strong economic data, including employment figures.
Sign up for ETFdb.com Pro and get access to real-time ratings on over 1,900 U.S.-listed ETFs.
Major Index Review
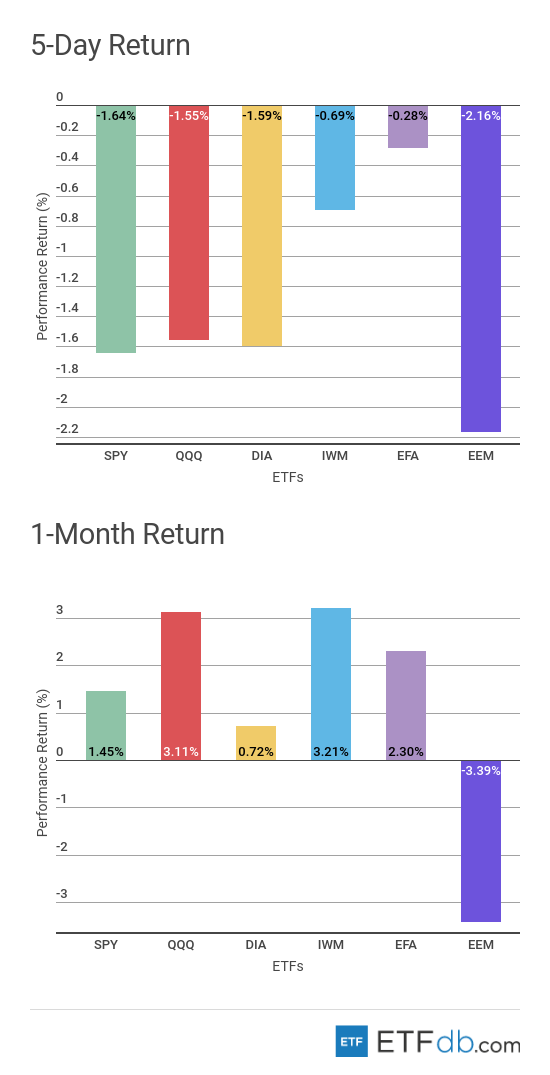
- Major indexes were all down.
- European and Asia Pacific index (EFA ) has kept the crown of the best performer this week, dropping just 0.28%. In no small part, European equities have held their ground thanks to a dovish European Central Bank, which acknowledged the overall economy has weakened.
- Emerging markets (EEM ), meanwhile, fell the most this week, down by 2.16%, with Brazil and Russia among the laggards. As a result, (EEM ) is also the worst performer for the rolling month and the single faller, down 3.4%.
- The small-cap index (IWM ) is the best monthly performer with an advance of 3.21%.
To see how these indices performed a week before last, check out ETF Scorecard: April 27 Edition.
Sectors Review
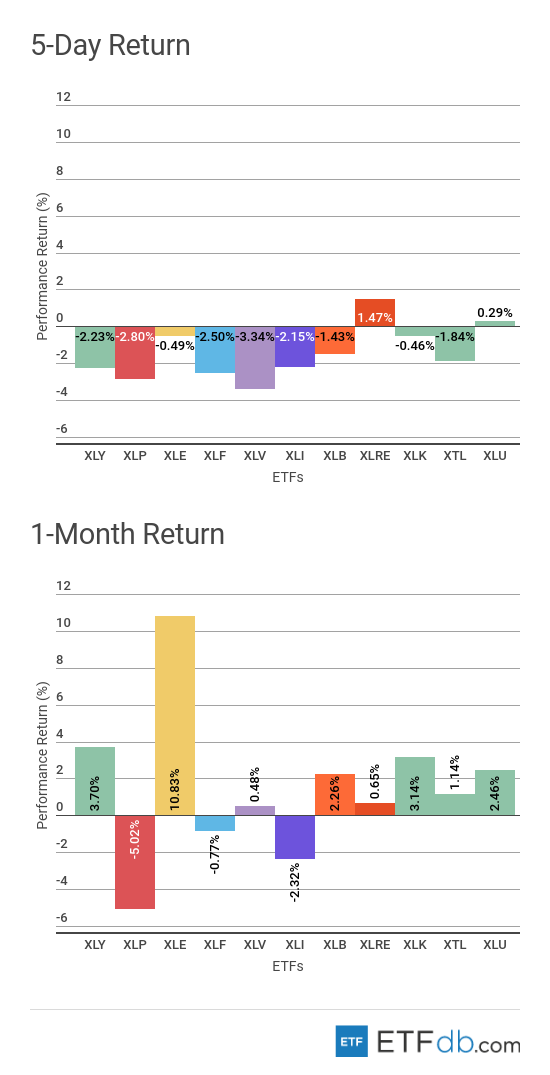
- Sectors were all down with a few exceptions.
- The real estate sector (XLRE ) was the best performer this week, edging up by 1.47%.
- Consumer staples (XLP ) have continued to drop this week, down by 2.8%, as the sector faces a double threat – rising competition from online peers and higher commodity prices. (XLP ) is also the worst performer for the rolling month, down 5.02%.
- The energy sector (XLE ) recorded a small loss for the week but remains the best performer for the rolling month, up 10.83%, thanks to rising oil prices.
Foreign Equity Review
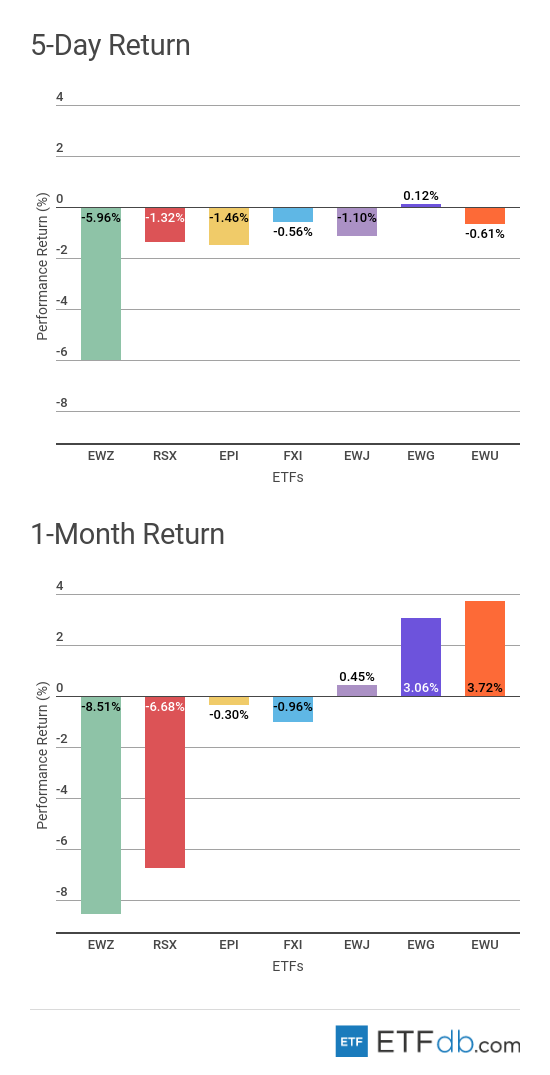
- Foreign equities were mostly down.
- Germany (EWG ) recovered from being the worst performer last week to becoming the only riser from the pack. (EWG ) has slightly risen by 0.12% in the past five days.
- Brazil (EWZ ) is undoubtedly the worst performer from the pack both for the week and the rolling month, down nearly 6% and 8.5%, respectively.
- Britain (EWU ) remains the best performer for the rolling month, up 3.72%, but disappointing data of late combined with Brexit issues may put pressure on equities going forward.
To find out more about ETFs exposed to particular countries, check out our ETF Country Exposure tool. Select a particular country from a world map and get a list of all ETFs tracking your pick.
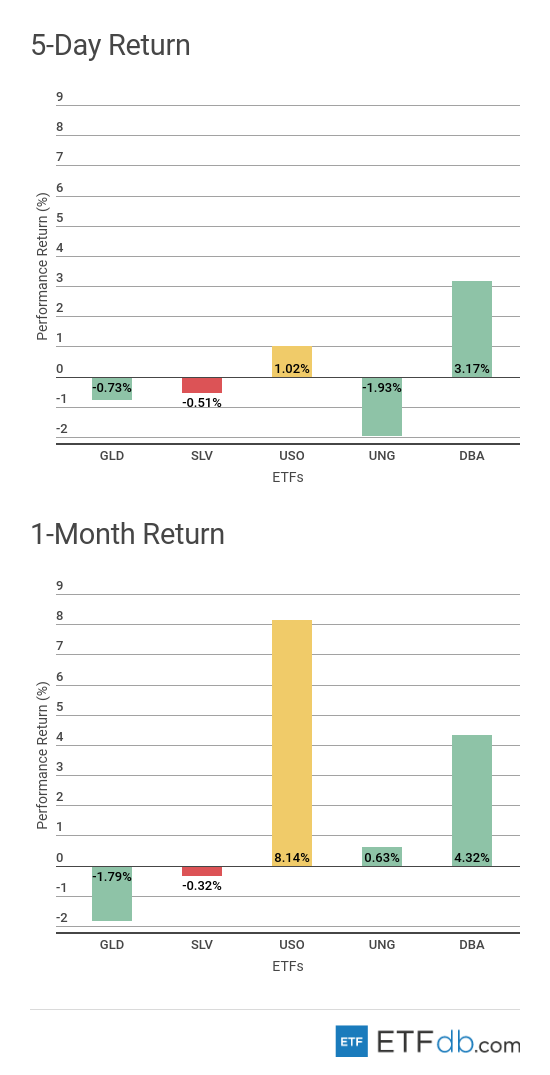
Commodities Review
- Commodities were mixed.
- The agricultural ETF (DBA ) has surged 3.17% in the past week, representing the best performance from the pack.
- Natural gas (UNG ), meanwhile, was the worst weekly performer with a decline of nearly 2%.
- For the rolling month, gold (GLD ) is the worst performer with a drop of 1.79%, while oil (USO ) is the best performer, up 8.14%.
Use our Head-to-Head Comparison tool to compare two ETFs such as (GLD ) and (DBA ) on a variety of criteria such as performance, AUM, trading volume and expenses.
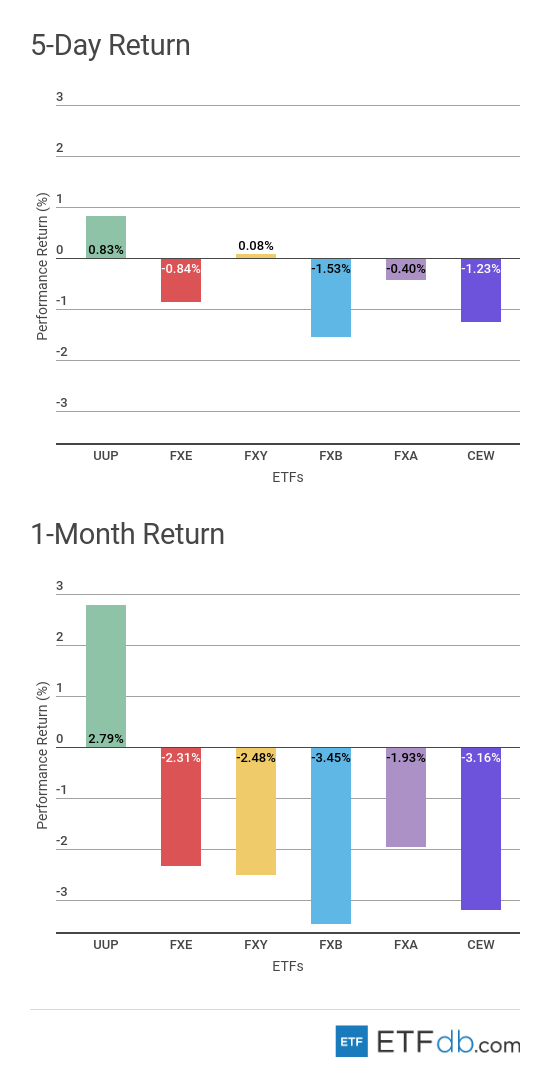
Currency Review
- The U.S. dollar (UUP ) is the king, reporting the highest gains both for the week and the rolling month. (UUP ) is up 0.83% in the past five days and has risen 2.79% in the past 30 days. The dollar was helped by a hawkish Federal Reserve, rising Treasury yields and subpar economic performance in Europe and Britain.
- The British pound (FXB ) is the worst performer for the past week and the rolling month, down 1.53% and 3.45%, respectively.
For more ETF analysis, make sure to sign up for our free ETF newsletter.

