
To help investors keep up with the markets, we present our ETF Scorecard. The Scorecard takes a step back and looks at how various asset classes across the globe are performing. The weekly performance is from last Friday’s open to this week’s Thursday close.
- This week was rich in events, with Donald Trump walking away from a deal with Iran to end its nuclear program and Bank of England maintaining its monetary policy stance.
- U.S. President Donald Trump tore apart a deal with Iran to end its nuclear program in exchange for access to the global markets, putting pressure on oil prices. Trump re-imposed economic sanctions on the country, making it harder for it to sell oil. Other signatory countries, including France, Germany and the U.K., said they will abide by the deal. Iran’s President Hassan Rouhani, who is seen as a moderate, said he will try to salvage the deal, although the more powerful supreme leader, Ayatollah Ali Khamenei, said he cannot trust the three countries.
- Bank of England has kept rates steady at 0.5%, saying it wants to see more evidence of economic recovery before it makes another hike. Bank of England members voted 7-2 to keep its monetary policy unchanged, despite wide expectations that it would raise rates. The bank cut its inflation forecast and growth outlook, but noted rates would have to rise going forward.
- U.K. manufacturing production dropped 0.1% in March, beating expectations by analysts, who forecasted a decline of 0.2%. Manufacturing production fell for the second month in a row.
- The U.S. unemployment reached a record low level of 3.9%, while the economy added a solid 164,000 jobs in April. Analysts had expected a figure of 191,000, but the prior month’s data was upwardly revised by 22,000 to 135,000. The widely watched average hourly earnings disappointed again, coming in below expectations – 0.1% growth compared to 0.2% forecast. Year-over-year, however, hourly earnings are up 2.6%.
- U.S. producer price index (PPI) rose 0.1% in April compared to the previous month and 2.6% year-over-year. Analysts had expected 0.3% monthly growth and a 3% rise for the year.
- Crude oil inventories dropped by 2.2 million barrels for the week ended May 4, ending a two-week string of gains. Last week, stockpiles rose by as much as 6.2 million barrels.
- Chinese CPI of 1.8% was a little below expectations of 1.9%, but the producer price index was in line with expectations at 3.4%.
- U.S. CPI, a gauge for inflation, rose by 0.2% in April month-over-month and 2.5% year-over-year, largely in line with expectations. The upbeat figures, combined with a strong jobs report, is increasing the likelihood the U.S. will raise interest rates quicker than currently expected.
Risk Appetite Review
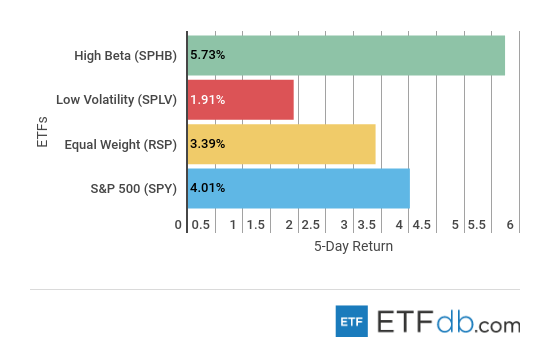
- Markets have posed a strong recovery this week.
- High Beta (SPHB ) was the best performer, surging 5.73%, as investors embraced risk.
- Low volatility (SPLV ) was the poorest performer from the pack with an advance of just 1.91%.
- The broad market (SPY ) has shot up 4% as many companies in the index reported strong quarterly results.
Sign up for ETFdb.com Pro and get access to real-time ratings on over 1,900 U.S.-listed ETFs.
Major Index Review
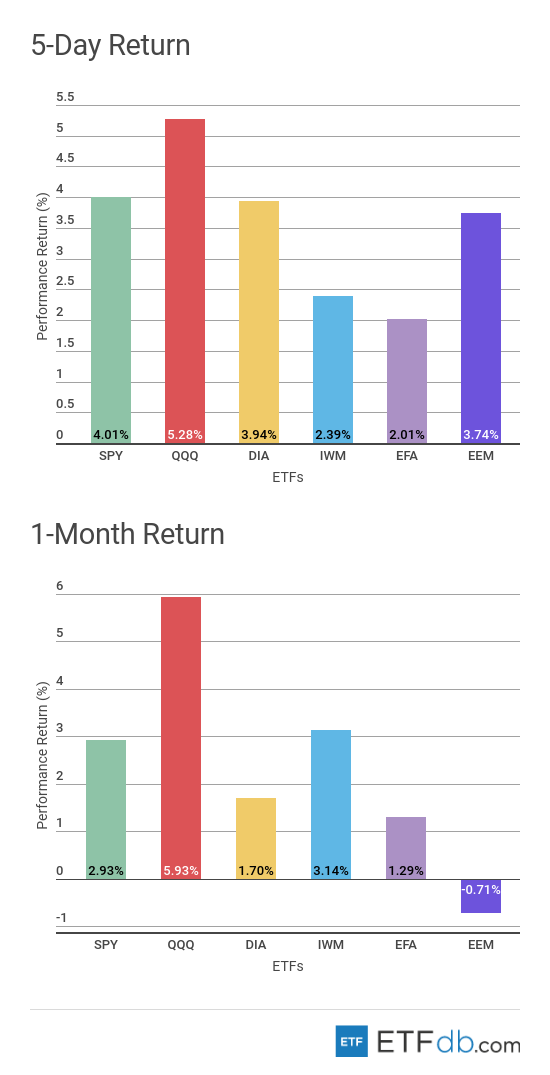
- Major indexes were all up.
- Technology stocks (QQQ ) gained 5.28% this week, the best performer, as a host of tech giants, including Apple (AAPL), Facebook and Amazon (AMZN) emerged with solid financial results for the first quarter of the year, largely beating expectations. (QQQ ) is also the best performer for the rolling month, up nearly 6%.
- The European and Asia Pacific index (EFA ) posted the smallest gains this week, rising a little more than 2%. (EFA )’s subdued performance comes on the heels of two strong weeks in which it was the best performer.
- Emerging markets (EEM ) are the only faller for the rolling month, down 0.71%.
To see how these indices performed a week before last, check out ETF Scorecard: May 4 Edition
Sectors Review
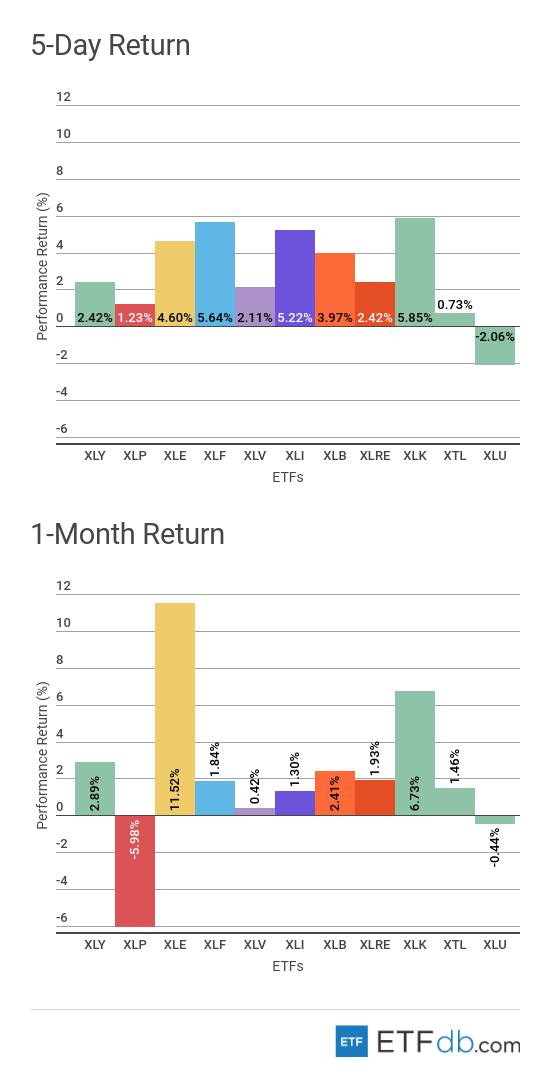
- Sectors were all up with one exception.
- The technology sector (XLK ) is the best performer for the week, up 5.85%, close to the financial sector and energy, which was boosted by skyrocketing oil prices.
- Utilities (XLU ), meanwhile, were the poorest performers for the week, with the index shedding more than 2% of its value. (XLU ) was shunned as investors flocked to riskier assets thanks to a strong earnings season.
- For the rolling month, the energy sector (XLE ) was the only to report double-digit gains, up 11.52%. (XLE ) was helped by rising oil prices, which are hovering to multi-year highs due to fears that the cancellation of the U.S.-Iran nuclear deal will hurt supplies.
- Consumer staples (XLP ) are the worst monthly performers, down nearly 6%, as many traditional retail companies continue to suffer from Amazon’s expansion plans.
Foreign Equity Review
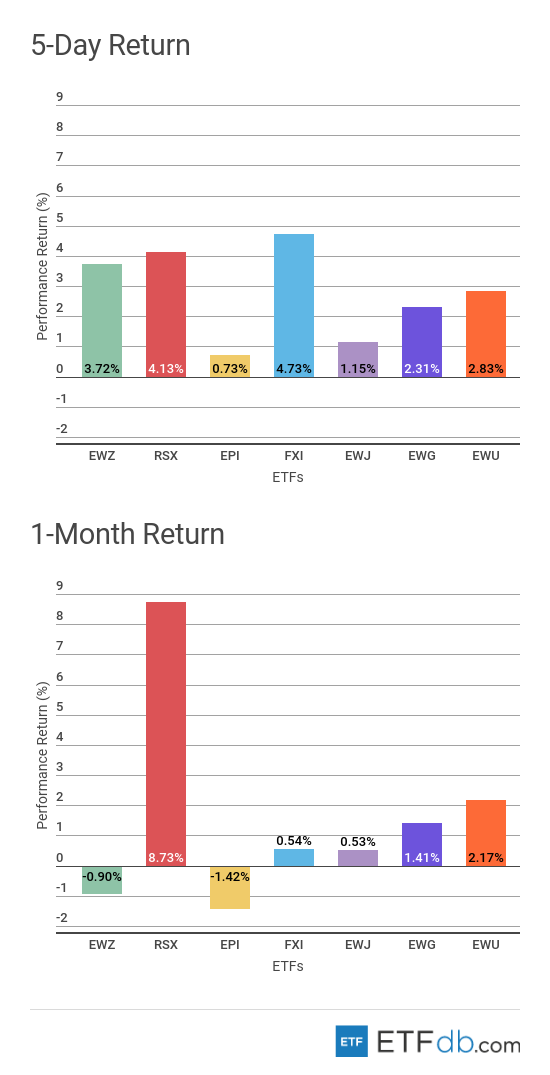
- Foreign equities were all up.
- China (FXI ) was the best performer of the week with an advance of 4.73%.
- India (EPI ) largely missed the global market rally, tepidly rising 0.73%. India is also the worst performer for the rolling month with a decline of 1.42%.
- Russia (RSX ) is the best performer this month, up an impressive 8.73% due to higher oil prices.
To find out more about ETFs exposed to particular countries, check our ETF Country Exposure tool. Select a particular country from a world map and get a list of all ETFs tracking your pick.
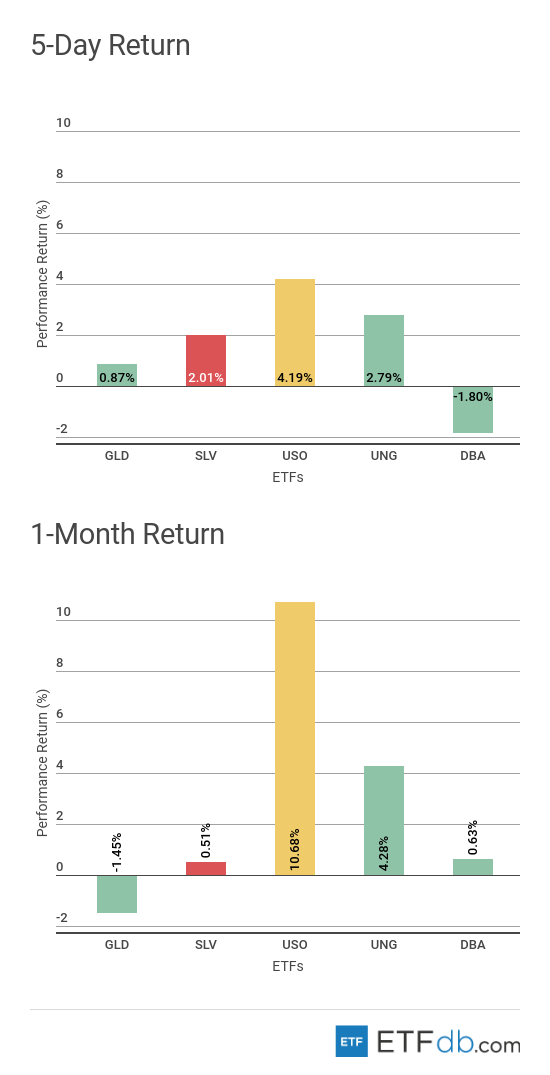
Commodities Review
- Commodities also had a good week.
- Oil (USO ) is the best performer both for the week and the rolling month, up 4.19% and 10.68%, respectively. The black commodity recently reached multi-year highs after the U.S. walked away from a deal to end Iran’s nuclear program. The cancellation of the accord prompted fears of supply disruption in the coming months.
- The agricultural fund (DBA ) dropped nearly 2% this week, representing the worst performance.
- Gold (GLD ), meanwhile, fell 1.45% for the past month, representing the worst performance.
Use our Head-to-Head Comparison tool to compare two ETFs such as (GLD ) and (DBA ) on a variety of criteria such as performance, AUM, trading volume and expenses.
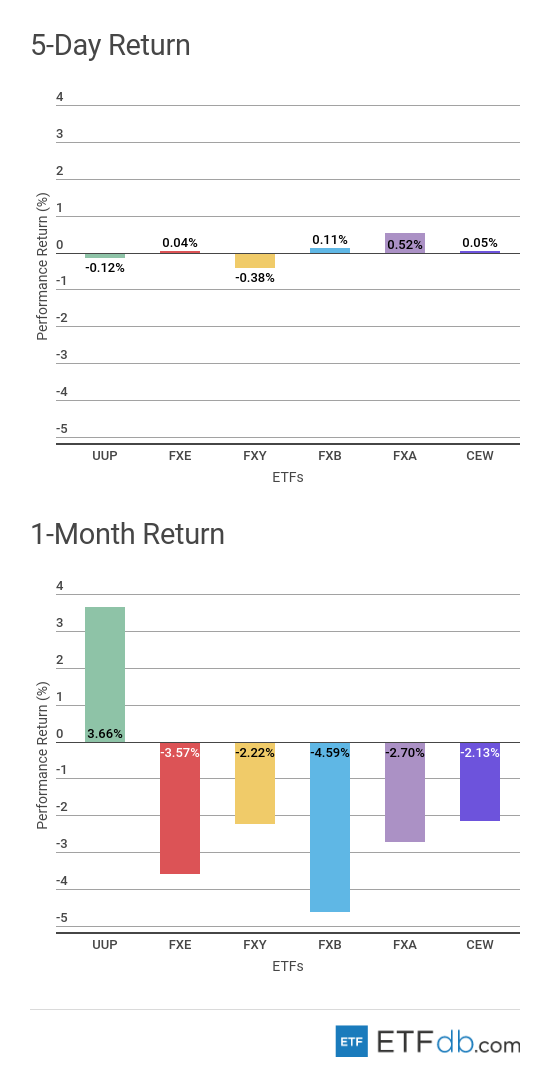
Currency Review
- The U.S. dollar (UUP ) ended a string of gains this week, falling 0.12% and becoming the second-worst performing currency after the Japanese yen (FXY ), which shed 0.38% of its value. The U.S. dollar, however, remains the best performer for the rolling month and the only gainer, up 3.66%.
- With a small rise of 0.52%, the Australian dollar (FXA ) is the best performer for the week.
- The British pound (FXB ) is down 4.59% for the past 30 days, representing the worst performance from the pack.
For more ETF analysis, make sure to sign up for our free ETF newsletter.

