
Crude oil continued to climb higher this week due to global political risks and the end of the Iran deal, trending in the first place for the second consecutive week.
Meanwhile, a flattening yield curve has directed attention to high-yield bonds, while government bonds stood third on the list. Cloud computing and consumer staples close the list.
Check out our previous trends edition at Trending: Oil Climbs to Multi-Year Highs on Iran Sanction Woes.
Oil Moves Sideways After Inventory Report
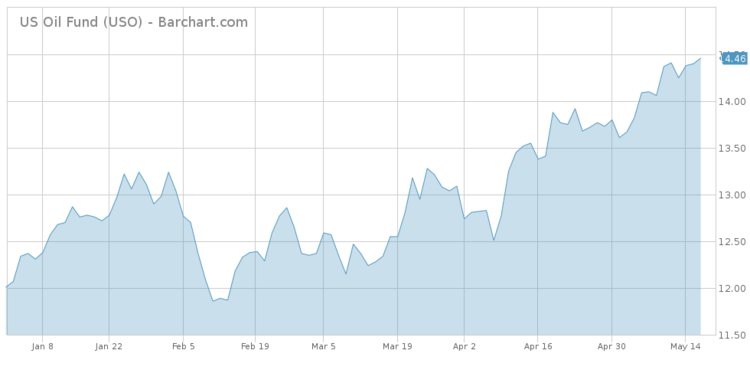
Crude oil is trending for the second consecutive week, generating a 230% increase in traffic. All eyes are on the geopolitical scene ever since President Donald Trump introduced uncertainty in the markets by re-imposing economic sanctions on Iran, a country responsible for nearly four million barrels of oil per day. Coupled with falling supply from Venezuela and an ongoing deal between the Organization of the Petroleum Exporting Countries (OPEC) and Russia to cut output, the cancellation of the Iran deal put significant upward pressure on oil markets.
United States Oil Fund (USO ) has risen 6% in the past month, extending year-to-date gains to as much as 20%. In the past five days, WTI crude largely moved sideways but stayed above the $70 per barrel level.
Sign up for ETFdb.com Pro and get access to real-time ratings on over 1,900 U.S.-listed ETFs.
The Paris-based Energy Information Association (EIA) said on Wednesday crude stockpiles dropped 1.4 million barrels for the week ended May 11. The EIA said the potential supply shock from Iran and Venezuela could present a major challenge for producers to halt price rises. In particular, if Iran’s exports drop consistently, the effects on the oil market will be felt. Last time sanctions were imposed on Iran, which is the world’s fifth largest producer, output fell by 1.2 million barrels per day. In the current case, the extent of the disruption remains a mystery, with the picture likely to become clearer in the next few months.
To keep the markets stable, Russia and the OPEC may decide to abandon their landmark agreement to shrink production by 1.2 million barrels per day, with Saudi Arabia potentially stepping in. All eyes will be on the next OPEC meeting, which takes place in mid-June.
High-Yield Bonds
High-yield bonds have been in the spotlight this week, as the yield curve is flattening amid rising interest rates and a booming economy in the U.S. High-yield bonds have taken the second spot in the list with an increase in viewership of 211%.
As a result of an increasing trend in 10-year Treasury yields, high-yield bonds have taken a hit lately, with iShares iBoxx $ High Yield Corporate Bond (HYG ) dropping more than 1% in the past five days alone. Since the beginning of the year, (HYG ) is down more than 2%.
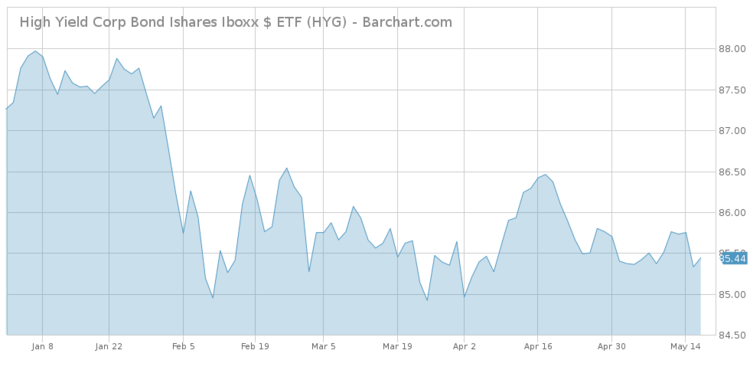
With the 10-year Treasury yields hovering beyond the 3% threshold, high-yield bonds felt the pressure. Outflows from bond funds have been ongoing for the past months, although performance held up. Despite rising yields, high-yield bonds are not expected to default en masse, in no small part thanks to a strong economy and rising earnings across the board. The riskier bonds connected to the U.S. shale sector may benefit going forward given the rising oil prices.
Further rate increases by the U.S. Federal Reserve may put many high-yield bond issuers in difficulty, particularly if an economic deceleration follows.
Government Bonds
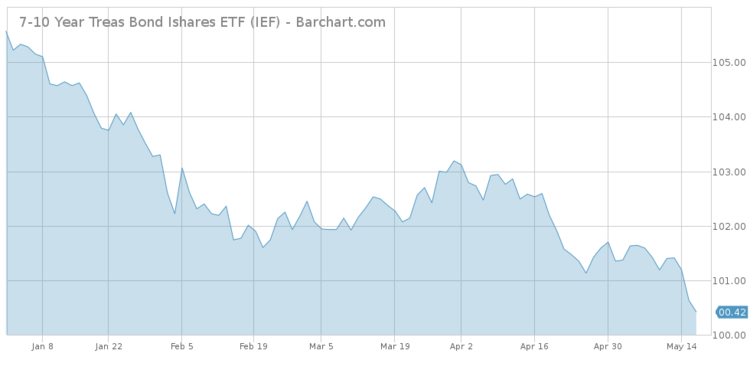
U.S. Treasury yields have held their ground this week, despite some weak economic data. Government bonds ETFs have seen their traffic advance 98%, far below high-yield bonds. Benchmark 10-year Treasuries have continued their slide this week, although yields have increased above the psychological 3% threshold. iShares 7-10 Year Treasury Bond (IEF ) has dropped 0.62% in the past five days, extending year-to-date losses by nearly 5%. When bond prices fall, yields rise.
For a deeper analysis on individual ETF investments such as (UUP ) or (QQQ ), use our ETF Analyzer tool. You can select ETFs by Category or Type as well as add individual ticker symbols to compare performance, expenses and dividend yield, among other metrics.
Retail sales in the U.S. were in line with expectations, rising by 0.3% in April. Core retail sales, meanwhile, rose by the same amount but were 20 basis points below the forecast. Housing starts disappointed, coming in at 1.28 million in April against 1.32 million expected by economists.
Although economic activity is slowing down, rising oil prices may put pressure on inflation, something that would force the Federal Reserve to raise rates sooner than expected.
Cloud Computing ETFs Outperforming
Cloud computing stocks have had a good ride recently, outperforming many indices, including technology-heavy peers. Cloud computing ETFs have taken the fourth spot in the list with a rise in viewership of 76%. The only ETF focusing on the emerging cloud computing sector, First Trust ISE Cloud Computing Index Fund (SKYY ), has increased around 13% since the beginning of the year, nearly double the performance of PowerShares QQQ (QQQ ).
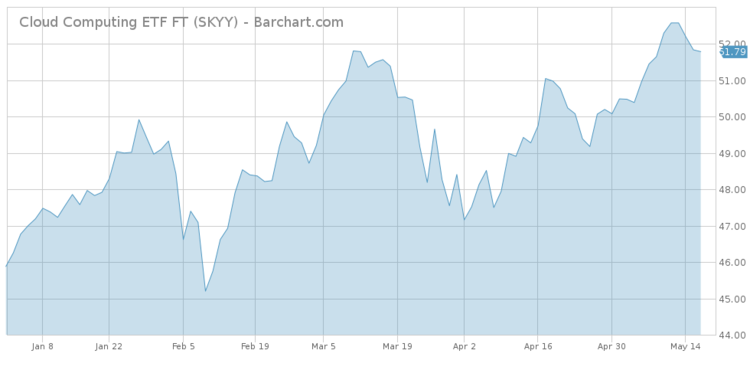
The outperformance has largely occurred thanks to strong earnings reported by the ETF’s exponents, including Netflix (NFLX), which is that largest holding in the fund and makes up 6.81%, and Amazon (AMZN), accounting for 5.3% of (SKYY ). Amazon, for instance, has largely become profitable in recent years due to the outperformance of its cloud computing division, called Amazon Web Services.
Consumer Staples Dropping on Poor Results
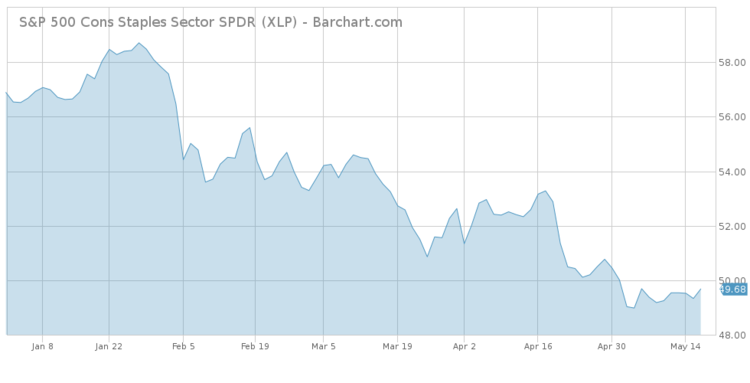
While cloud computing ETFs are among the best-performing assets, consumer staples is one of the sectors posting heavy losses. As consumer tastes shift from brick and mortar to online to exclusive products, with Amazon being a primary beneficiary, consumer staples are suffering. Indeed, Consumer Staples Select Sector SPDR Fund (XLP ) has declined more than 12% since the beginning of the year, underperforming the S&P 500 by around 10 percentage points.
XLP’s largest exponent, Procter & Gamble (PG), which makes up nearly 12% of the fund, is down nearly 20% since the beginning of the year, after the company reported two straight quarters of disappointing results and poor revenue guidance. Coca Cola (KO) and Pepsi (PEP), collectively making up nearly 20% of the fund, have dropped 9% and 19%, respectively, since the beginning of the year, as consumer habits in the U.S. are shifting to healthier alternatives. Moreover, Walmart (WMT) has tumbled more than 12% since January 1.
The Bottom Line
This week, oil continued its march ahead as investors weighed the implications of Venezuela and Iran dropping their output. As the yield curve is flattening, high-yield bonds are suffering outflows, although strong earnings and high oil prices could offset the negative impact. Government bonds have crossed the psychological 3% threshold. Cloud computing ETFs have outperformed their technology counterparts thanks to rising and high-profit margins, while consumer staples stocks have disappointed.
By analyzing how you, our valued readers, search our property each week, we hope to uncover important trends that will help you understand how the market is behaving so you can fine-tune your investment strategy. At the end of the week, we’ll share these trends, giving you better insight into the relevant market events that will allow you to make more valuable decisions for your portfolio.

