To help investors keep up with the markets, we present our ETF Scorecard. The Scorecard takes a step back and looks at how various asset classes across the globe are performing. The weekly performance is from last Friday’s open to this week’s Thursday close.
- The U.S.-China negotiations are in full swing, with both countries making progress in reaching a deal. The U.S. is close to lifting its ban on U.S. firms supplying Chinese gear-maker ZTE, while Beijing announced tariff cuts on car imports. However, Trump apparently backed down from the current agreement, saying that ultimately a different structure would have to be used.
- The summit between North Korea and the U.S. has been canceled, with Washington citing Pyongyang’s “open hostility.” President Trump said the U.S. and its allies were military ready if the situation on the North Korean peninsula gets heated.
- Across the Atlantic, Bank of England’s President Marc Carney noted that the economy did not evolve in line with its February forecasts, adding interest rates are likely to rise at a gentle pace. Carney also said that Brexit will cost each British household 900 pounds.
- Federal Reserve is not worried about the U.S. economy overheating, according to the minutes of its most recent meeting. The central bank also appears willing to tolerate inflation above 2% for a temporary period as the economy continues to expand. An increase in the pace of rate hikes is not imminent.
- Britain’s consumer price index is falling. In April, inflation stood at 2.4 compared to 2.5% forecasted by analysts. In the previous month, inflation was at 2.5%. This likely gives the Bank of England the possibility to keep interest rates low for longer, hitting the pound. Core CPI grew 2.1% in April compared to the same month last year.
- Eurozone’s economy is undergoing a rough patch, at least based on a host of purchasing managers’ indexes. Germany’s May PMI of 56.8 was below expectations of 57.9 and marked a fall from 58.1 in April. The overall Eurozone PMI fell to 55.5 in May from 56.2 in the prior month.
- U.S. new home sales of 662,000 for the month of April were below consensus estimates of 677,000. In the prior month, home sales came in at 694,000.
- Crude oil inventories have surged 5.8 million barrels for the week ended May 18, while gasoline supplies advanced 1.9 million barrels.
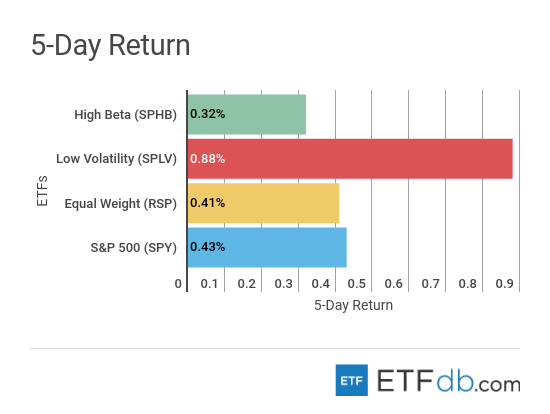
Risk Appetite Review
- Markets had a good week.
- Low volatility (SPLV ) was the best performer, rising 0.88%.
- Riskier assets (SPHB ) recorded the smallest gain, up 0.32%, after a few weeks of solid advances.
- The broad market (SPY ) rose 0.43%.
Sign up for ETFdb.com Pro and get access to real-time ratings on over 1,900 U.S.-listed ETFs.
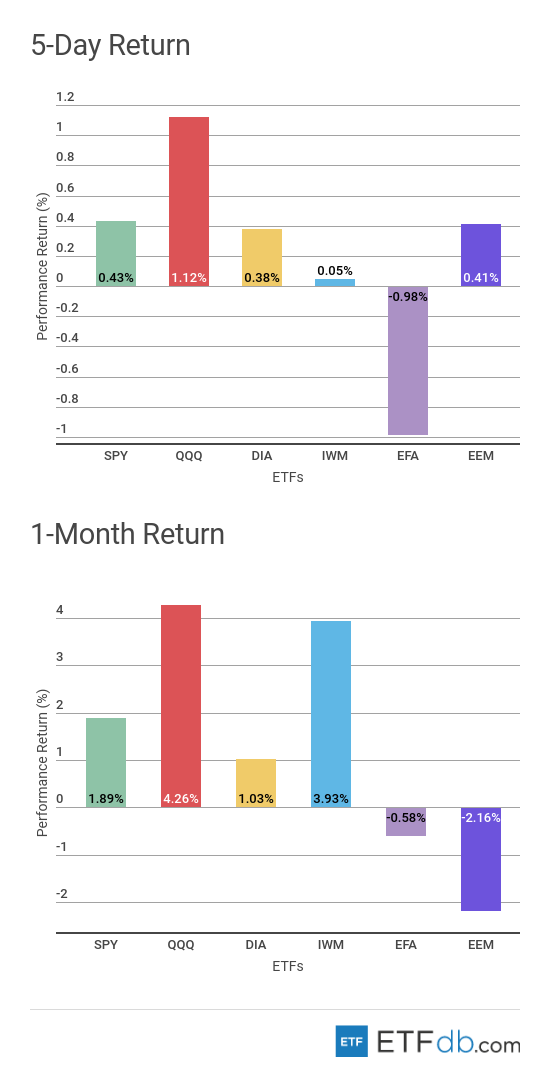
Major Index Review
- Major indexes posted mixed results on subdued volatility.
- Technology stocks (QQQ ) edged up 1.12% in the past week, representing by far the best performance. Buoyed by strong earnings, (QQQ ) is also the best performer for the rolling month, up 4.26%.
- iShares MSCI EAFE ETF (EFA ), a non-U.S. developed market index, was the worst weekly performer as economic data from Europe disappointed. Germany, Japan and Britain were among the chief detractors.
- For the rolling month, however, emerging markets (EEM ) was the worst performer with a fall of 2.16%. A strong U.S. dollar has hit emerging markets across the board, while a fresh round of crisis in Argentina stoked fears of an impending market rout.
To see how these indices performed a week before last, check out ETF Scorecard: May 18 Edition
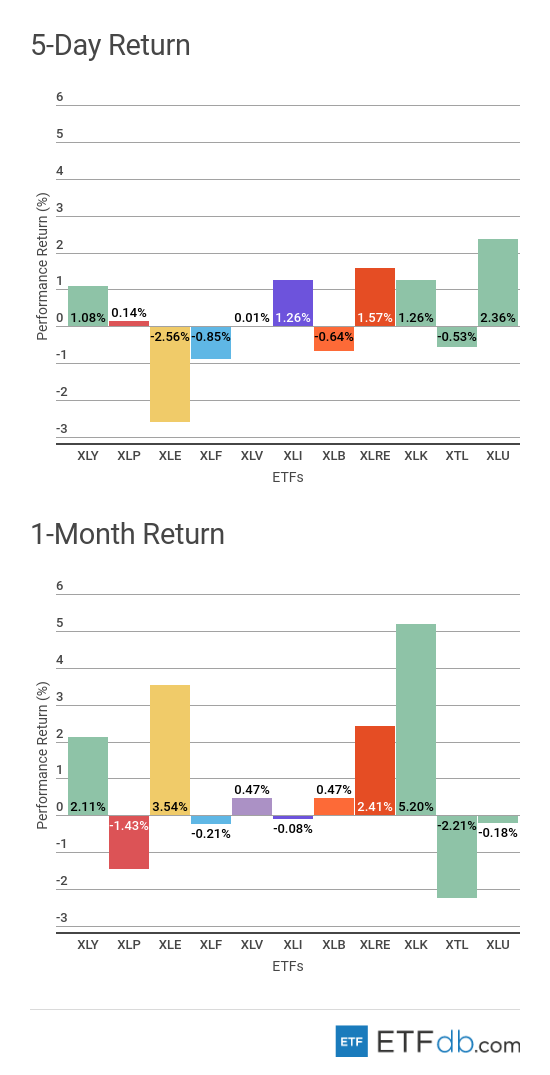
Sectors Review
- Sectors were rather mixed.
- After being shunned for a few weeks, utilities (XLU ) are back in fashion, rising a solid 2.36% in the past five days as demand for safe-haven assets increased.
- The energy sector (XLE ), meanwhile, declined 2.56% this week, reversing some of the gains experienced in the previous weeks on the back of high oil prices.
- For the rolling month, the technology sector (XLK ) is the best performer with an advance of 5.2%, while the telecom sector (XTL ) recorded the worst losses, down 2.21%.
Use our Head-to-Head Comparison tool to compare two ETFs such as (XLU ) and (XLK ) on a variety of criteria such as performance, AUM, trading volume and expenses.
Foreign Equity Review
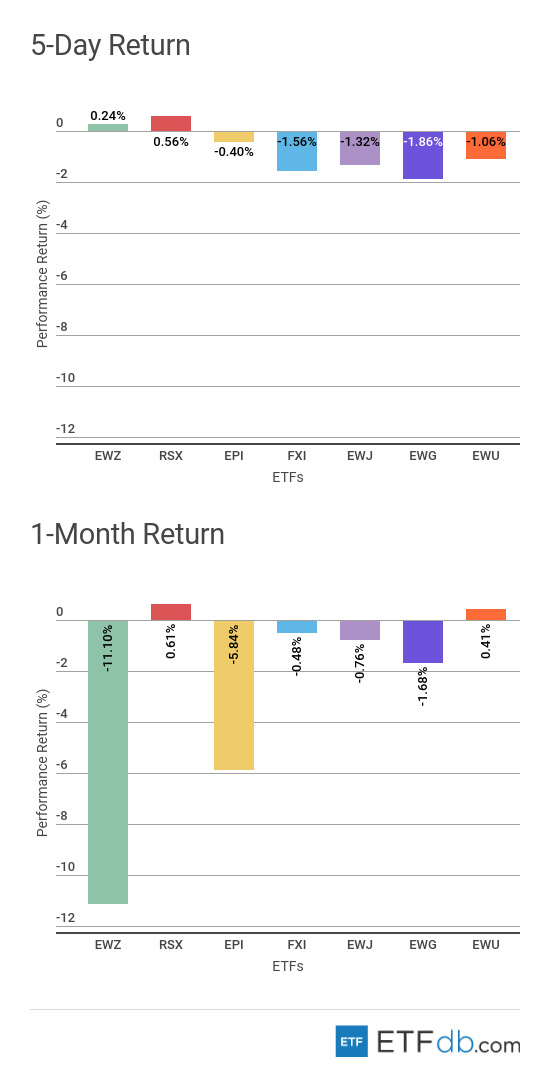
- Foreign equities were all down with a few exceptions.
- Russia (RSX ) was the biggest winner this week, rising 0.56% on the back of high oil prices. Russia is also the best performer for the rolling month, up 0.61%
- Germany (EWG ) was the worst weekly performer with a decline of 1.86% due to uncertainty stemming from the new populist government in Italy.
- Brazil (EWZ ) has dropped a staggering 11.1% for the rolling month, partly due to fears the Argentina crisis will spread to other South American countries.
To find out more about ETFs exposed to particular countries, check our ETF Country Exposure tool. Select a particular country from a world map and get a list of all ETFs tracking your pick.
Commodities Review
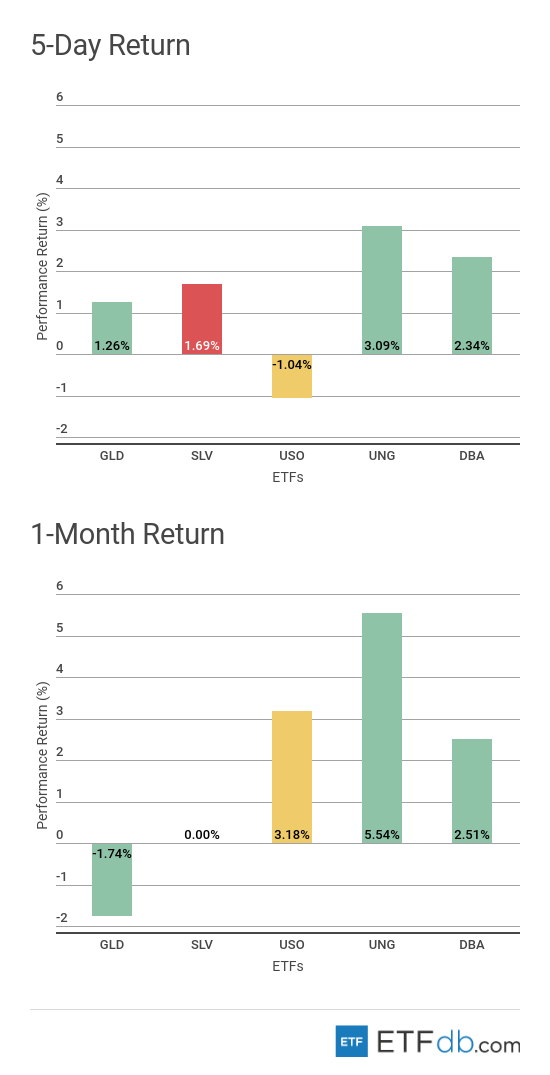
- Commodities were all up with the exception of oil.
- Natural gas (UNG ) has continued its rally this week, increasing more than 3%. The strong performance helped the commodity become the best performer for the rolling month, up 5.5%. U.S. inventories are rising close to estimates.
- Crude oil (USO ) was the only faller this week, dropping by more than 1%, erasing some of the gains reported in previous weeks.
- For the rolling month, gold (GLD ) is the worst performer and the only commodity that declined.
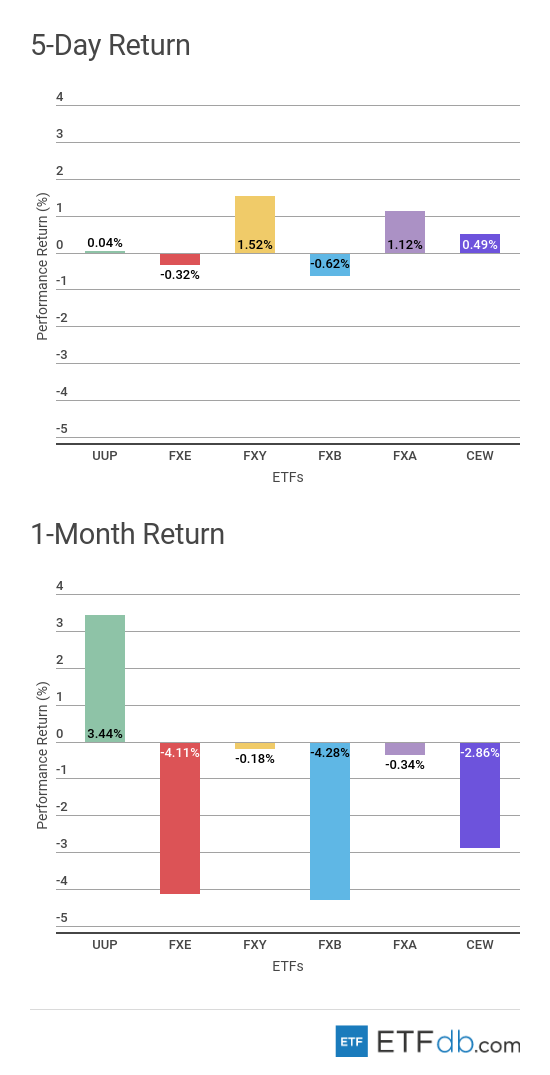
Currency Review
- The U.S. dollar (UUP ) continued to shine but the Japanese yen (FXY ) was the best weekly performer with a rise of 1.52%, as global risks stemming from the failed summit between the U.S. and North Korea and Italy tensions increased demand for safe-haven assets. However, the U.S. dollar remained the best monthly performer with a gain of 3.44%.
- The British pound (FXB ) fell 0.62% this week as the nation’s central bank indicated it will not hurry to increase interest rates. (FXB ) is also the worst performer for the rolling month, down 4.28%.
For more ETF news and analysis, subscribe to our free newsletter.