
To help investors keep up with the markets, we present our ETF Scorecard. The Scorecard takes a step back and looks at how various asset classes across the globe are performing. The weekly performance is from last Friday’s open to this week’s Thursday close.
- The U.S. – China negotiations to avert a damaging trade war started on Thursday. The Trump administration is asking China to cut trade surplus with the U.S. by $200 billion. At the same time, the U.S. threatened to impose tariffs on $150 billion worth of Chinese goods. In 2017, the U.S. trade deficit with China surpassed $375 billion.
- A summit between the U.S. and North Korea may not take place after all. North Korea threatened to not attend the meeting if the U.S. insisted on the country giving up its nuclear arsenal unilaterally.
- U.K. wages grew by 2.6% in the first three months of 2018, slower compared to the same period a year earlier, when total pay was up by 2.8%. Stripping out inflation, regular wages grew by 0.4% during the period.
- U.S. retail sales grew by 0.3% in April month-over-month, in line with expectations. Core retail sales rose by the same amount but analysts had expected growth of 0.5%.
- Eurozone GDP grew by 0.4% in the first quarter of 2018, just as analysts had forecasted. This marks a deceleration compared to the previous quarter and the same period last year when output increased by 0.6% and 0.5%, respectively.
- U.S. housing starts disappointed in April, coming in at 1.28 million compared to 1.32 million expected by economists. Starts also fell from a revised 1.33 million in the prior month. Housing permits, meanwhile, held up at a healthy level and were largely in line with expectations of 1.35 million.
- Crude oil inventories dropped by 1.4 million barrels for the week ended May 11, representing the second consecutive weekly decline. Gasoline stocks also dropped by 3.8 million barrels.
- Jobless claims rose by 11,000 to 222,000 in the May 12 week, disappointing expectations of 215,000.
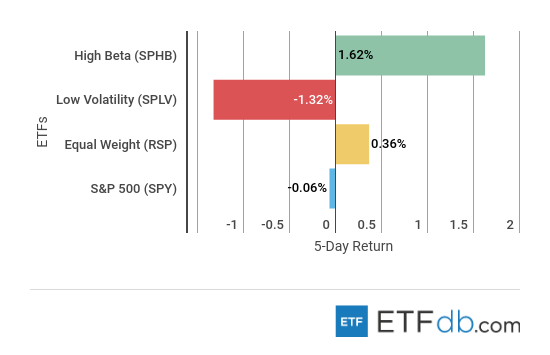
Risk Appetite Review
- Markets were rather mixed this week.
- Riskier assets (SPHB ) continued to be favored by investors, increasing 1.62% in the past five days.
- Low volatility (SPLV ), meanwhile, was the worst performer with a drop of 1.32%.
- The broad market (SPY ) was slightly down.
Sign up for ETFdb.com Pro and get access to real-time ratings on over 1,900 U.S.-listed ETFs.
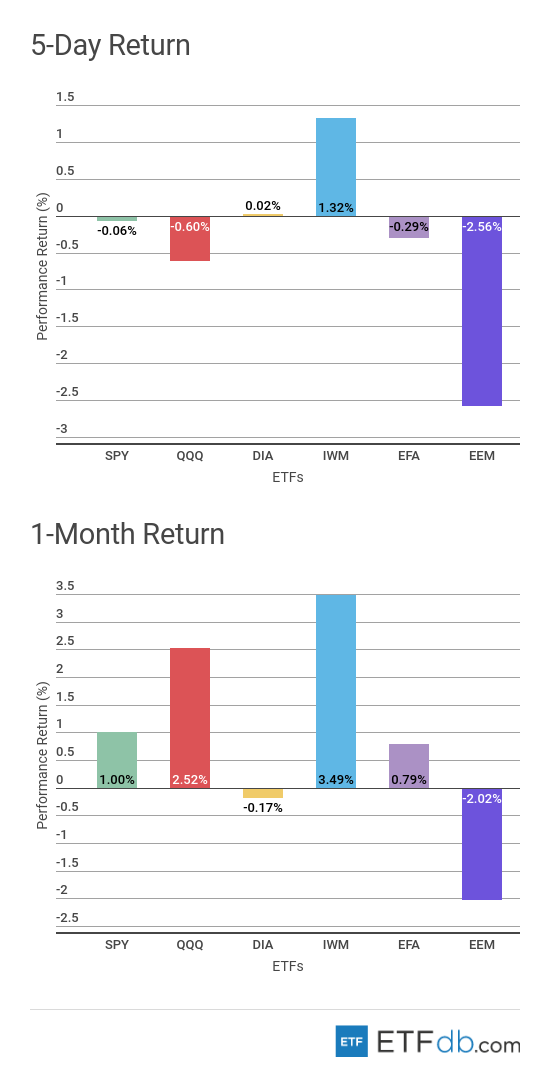
Major Index Review
- Major indexes were mixed.
- U.S. small cap stocks (IWM ) have risen 1.32% for the week, extending monthly gains to 3.49%. (IWM ) is the best performer both for the week and the rolling month, as the asset is largely insulated from fears over international trade relations, particularly China and the U.S.
- Emerging markets (EEM ) dropped the most this week by 2.56%, due to losses in Brazil and India. (EEM ) remains the worst monthly performer with a fall of more than 2%.
To see how these indices performed a week before last, check out ETF Scorecard: May 11 Edition
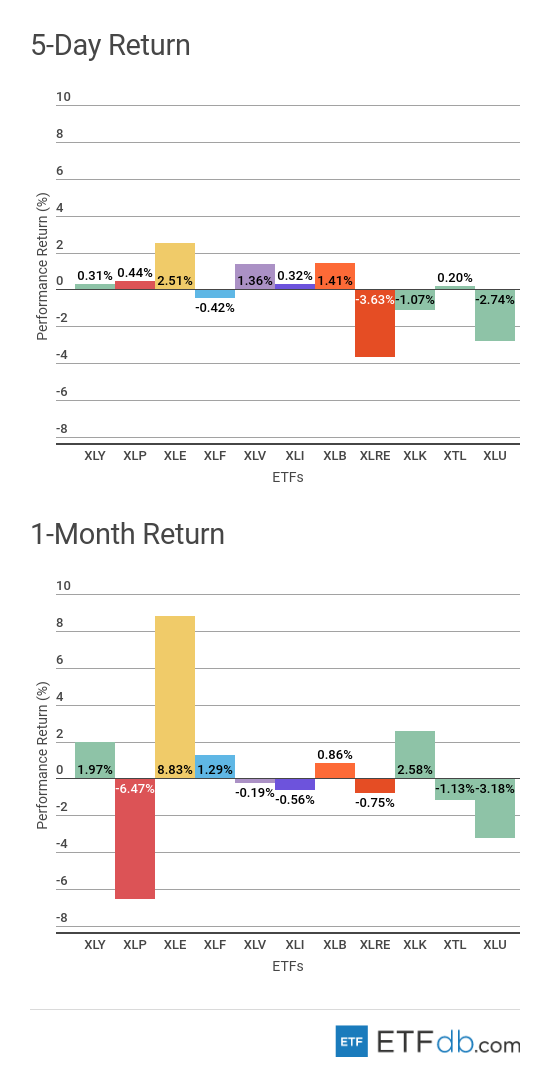
Sectors Review
- Sectors were rather mixed.
- The energy sector (XLE ) continued its march ahead thanks to rising oil prices. (XLE ) is the best performer both for the week and the rolling month, up 2.51% and 8.83%, respectively. Oil has been surging of late as Iran, the world’s fifth-largest producer and Venezuelan supplies are at risk. The U.S. re-imposed sanctions on Iran, but the true extent of the disruption is yet unclear.
- The real estate sector (XLRE ) has swooned 3.63% this week, as yields continued to rise across the board. Rising interest rates means property developers will borrow money at higher rates, hitting bottom lines.
- Consumer staples (XLP ) tumbled 6.47% for the rolling month as the industry faces strong competition from online retailers and small producers.
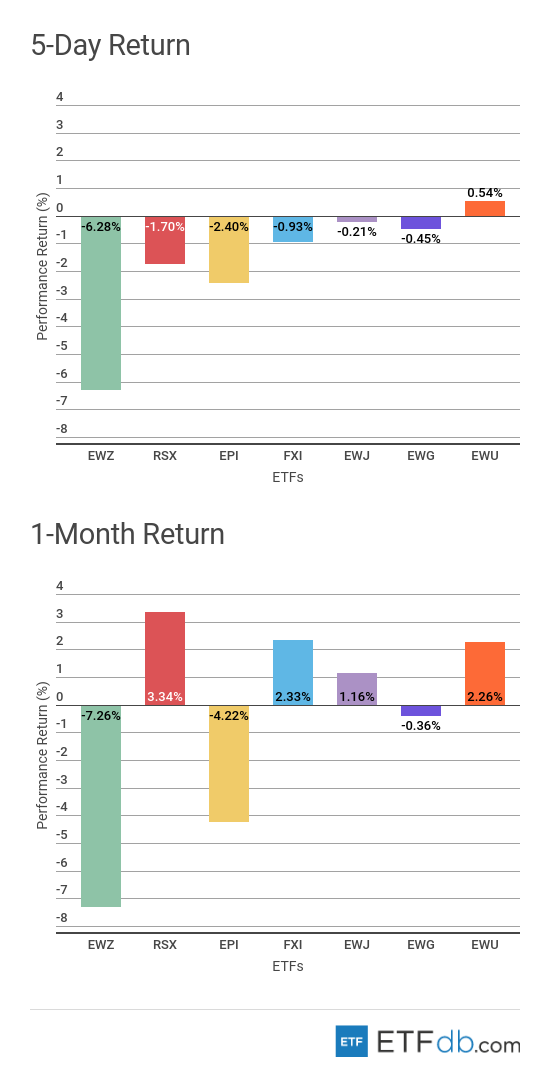
Foreign Equity Review
- Foreign equities were all down with one exception.
- Brazil (EWZ ) was the worst performer both for the week and the rolling month, losing 6.3% and 7.3% of its value, respectively. In no small part, Brazilian stocks were battered by rising yields in the U.S., which sparked a global sell-off in riskier assets.
- Britain (EWU ) is the best performer this week, posting a tepid gain of 0.54%.
- For the rolling month, Russia (RSX ) is the best performer with an advance of 3.34% as the country’s stocks benefited from rising oil prices.
To find out more about ETFs exposed to particular countries, check our ETF Country Exposure tool. Select a particular country from a world map and get a list of all ETFs tracking your pick.
Commodities Review
- Commodities had a mixed week.
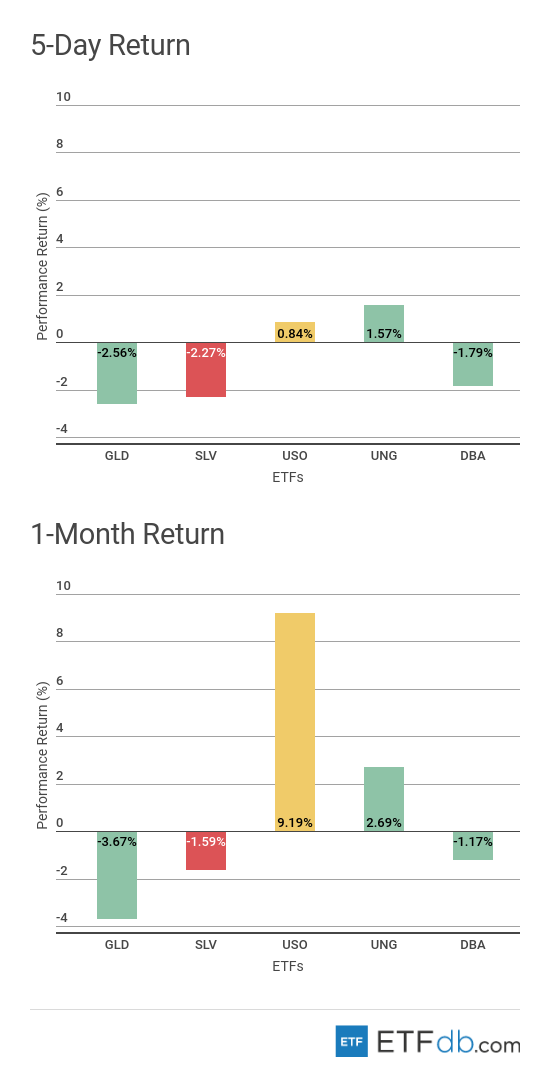
- Gold (GLD ) was the poorest performer from the pack both for the week and the rolling month due to rising yields in the U.S. (GLD ) dropped 2.56% in the past five days, extending monthly losses to 3.67%.
- Natural gas (UNG ) advanced 1.57% this week, representing the best performance, with oil (USO ) coming in second in the list.
- Crude oil (USO ) is the clear winner for the past 30 days, surging as much as 9.2%.
Use our Head-to-Head Comparison tool to compare two ETFs such as (GLD ) and (UNG ) on a variety of criteria such as performance, AUM, trading volume and expenses.
Currency Review
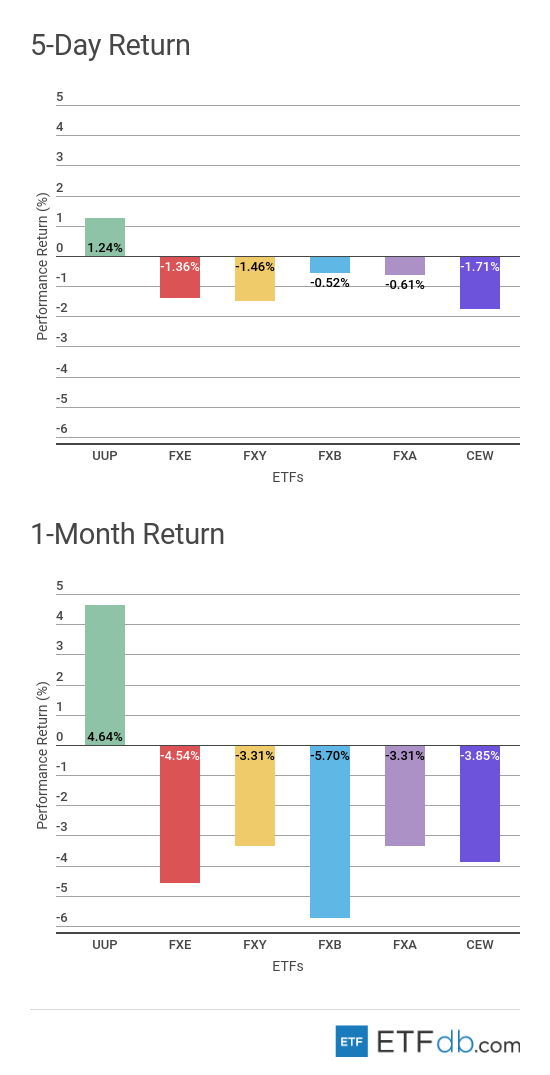
- The U.S. dollar (UUP ) resumed its rally this week, rising 1.24%. As a result, the greenback is the only gainer for the week and is also the best performer for the rolling month, up 4.64%.
- Emerging markets currencies (CEW ) dropped 1.71% this week, representing the worst performance from the pack as investors shunned riskier assets round the globe.
- The British pound (FXB ) remains the worst performer for the rolling month, down 5.7%.
For more ETF analysis, make sure to sign up for our free ETF newsletter.

