
Crude oil has again taken the headlines this week along with the ongoing political debacle in Italy. The black commodity started to reverse gains after Saudi Arabia and Russia hinted that output could be boosted to avoid a supply shock. Regional banks trended second after U.S. Congress rolled back legislation aimed to prevent a fresh financial crisis. Small-Cap Index Russell 2000 felt like a safe haven amid the market turmoil and was third in the list. Emerging markets equities and emerging markets bonds close the list.
Check out our previous trends edition at Trending: Strong Dollar Plunges Argentina Into Crisis, Again
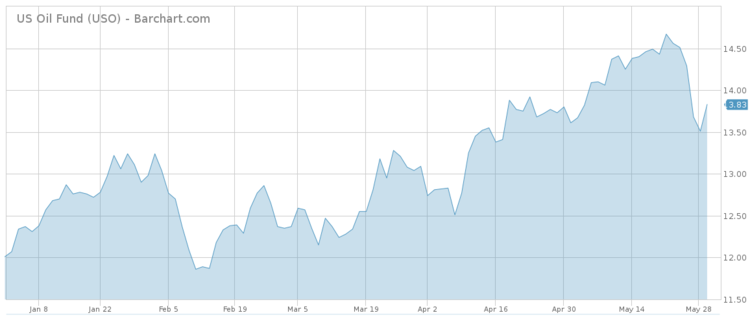
Crude Oil Falls on Potential Supply Boost
Crude oil has seen its traffic jump as much as 188% in the past week, as the black commodity capped a streak of gains. In fact, United States Oil (USO ) has dropped more than 5% this week, after comments made by Saudi Arabia’s energy minister that OPEC and Russia may agree to boost output to keep the markets well supplied. Oil has also suffered from the political crisis in Italy, which spooked world markets and increased fears of economic deceleration, something that would dent demand for oil.
Sign up for ETFdb.com Pro and get access to real-time ratings on over 1,900 U.S.-listed ETFs.
Saudi Energy Minister Khalid Al-Falih made clear at a business forum in Russia that talks within OPEC are ongoing about a potential move to boost supplies in order to make up for the slump in Venezuelan output. OPEC and Russia are scheduled to meet in Vienna on June 22 to talk about the potential easing of self-imposed output cuts. An official announcement could be made immediately after the meeting, the energy minister hinted.
Further putting downward pressure on oil prices, U.S. production has been increasing at a fast pace as shale producers have been slowly returning to the market. According to Baker Hughes, an oilfield services firm, the rig openings reached the highest level in more than a year recently. Meanwhile, U.S. crude production surged by around 25% since mid-2016, when oil prices were quite depressed.
Oil prices curbed their downward slide after a media report said Saudi Arabia will maintain a deal with Russia to cut supplies until the end of 2018. The rally was smothered, however, because the Reuters report said the oil-producing countries were ready to gradually increase output to keep markets stable.
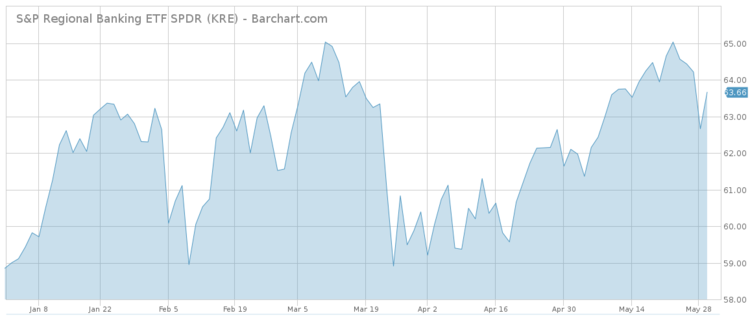
M&A in Regional Banking Possible After Dodd-Frank Rollback
U.S. Congress has rolled back regulations aimed to stem another financial crisis, potentially spurring a consolidation wave among regional banks. As such, regional banks ETFs have taken the second spot in the list this week, experiencing a rise in viewership of 134%. SPDR S&P Regional Banking (KRE ) has advanced around 1.5% in the past month, extending year-to-date gains to more than 8%.
The new regulation essentially cuts regional banks some slack. Whereas previously banks with more than $50 billion in assets under management were considered systemically important financial institution (SIFI), now that threshold has been raised to $250 billion. A SIFI bank has to put aside more capital against loans and cannot take as many risks to boost profitability.
With the rollback in place, the number of banks that would seek to combine will increase, particularly given the digitalization of the banking sector, which requires big investments in technology. For instance, two banks with $30 billion in assets would be able to merge without being designated a SIFI institution. That would free up more capital for loans and investments in technology to keep earnings growing.
In addition to (KRE ), investors may gain exposure to the potential consolidation by acquiring iShares U.S. Regional Banks (IAT ), up 16% over the past 12 months, and PowerShares KBW Regional Banking Portfolio (KBWR ), which has surged nearly 17% in the past year.
Use our Head-to-Head Comparison tool to compare two ETFs such as (KBWR ) and (IAT ) on a variety of criteria such as performance, AUM, trading volume and expenses.
For more ETF news and analysis, subscribe to our free newsletter.
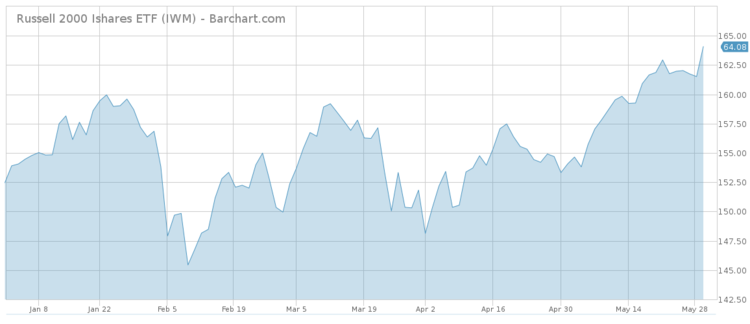
Small-Cap ETFs Benefiting from Global Turmoil
Amid renewed political uncertainty in the European Union stemmed from the political debacle in Italy, an ongoing trade spat between the U.S. and China and emerging markets jitters, one side of the market fared surprisingly well. Traffic to small-cap ETFs has increased by 109% this week as the sector continued to thrive amid a global market sell-off. Indeed, iShares Russell 2000 (IWM ) reached a record high this week and was up around 2%. After some rocky ups and downs, the broad market, the S&P 500 (SPY ) closed flat for the week ended Thursday.
Most likely, investors realized that small-cap stocks are largely insulated from geopolitical clashes, the Italian political stalemate and the trade negotiations between the U.S. and China. By and large, U.S. small-cap companies have exposure chiefly to the U.S. economy, which is booming despite the fact that GDP growth for the first quarter came in slightly lower than expected at 2.2%.
Small-caps may avoid heat from global economic uncertainty, but an eventual deterioration in the U.S. economic prospects will hurt them as well. For now, however, small-cap stocks are acting like other safe havens, i.e. the Japanese yen and gold.
For a deeper analysis of individual ETF investments such as (IWM ) or (KRE ), use our ETF Analyzer tool. You can select ETFs by Category or Type as well as add individual ticker symbols to compare performance, expenses and dividend yield, among other metrics.
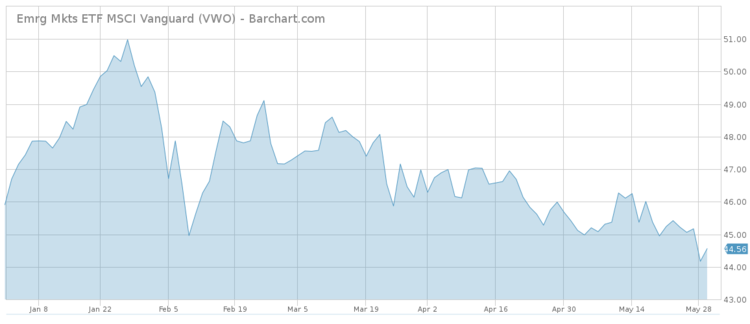
Emerging Markets Equities
Emerging markets equities have continued to slide this week due to an atlas of reasons, including a strong dollar and fears of a China-U.S. trade war. Emerging markets equities have seen their viewership rise within a whisker of 100% in the past week.
Vanguard FTSE Emerging Markets (VWO ) has dropped 1.5% in the past five days, extending year-to-date losses to nearly 3%. From the peak reached on January 26, (VWO ) has declined around 13%.
Chinese equities make up more than a third of the fund, followed by Taiwan with 15% and India with 10%. Mainland Chinese equities are on track to be included in the MSCI indexes, a move that will trigger a host of buying by index funds such as Vanguard and BlackRock. However, foreign buying of Chinese stocks was weak ahead of the inclusion in the indexes, in no small part due to the ongoing trade spat between the U.S. and China.
To find out more about ETFs exposed to particular countries, use our ETF Country Exposure tool. Select a particular country from a world map and get a list of all ETFs tracking your pick.
Emerging Markets Bonds
Unsurprisingly, emerging markets bonds have had a rough ride lately as a strong dollar coupled with rising yields in the U.S. spurred outflows from the asset class. The struggle of emerging markets debt has triggered an increase in viewership of 83% in the past week.
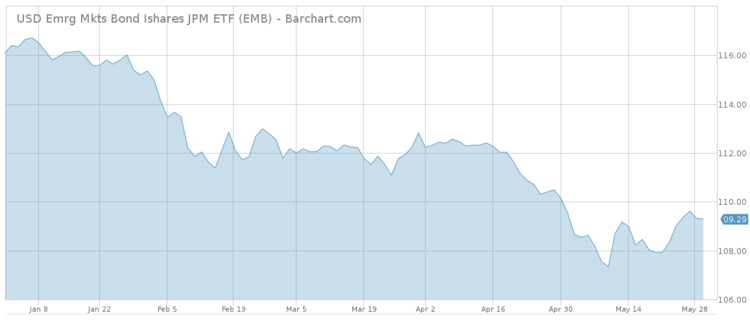
iShares J.P. Morgan USD Emerging Markets Bond (EMB ), an ETF holding paper from many emerging markets, including Russia, Poland, Uruguay and Egypt, has declined nearly 6% since the start of the year. In the past five days, (EMB ) rose 0.25% as American bond yields dropped as demand for safety increased after the political crisis in Italy.
The Bottom Line
This week, crude oil has made headlines as it started to reverse gains following comments by the Saudi energy minister that OPEC and Russia may increase supplies to keep markets stable. The rollback of financial regulations by U.S. Congress has created M&A opportunities for regional banks, which may see appreciating stocks going forward. Small-cap stocks have been resilient in the face of a political storm in Italy and trade jitters between the U.S. and China. Finally, emerging markets stocks and debt have been hit by rising U.S. yields and a soaring dollar.
By analyzing how you, our valued readers, search our property each week, we hope to uncover important trends that will help you understand how the market is behaving so you can fine-tune your investment strategy. At the end of the week, we’ll share these trends, giving you better insight into the relevant market events that will allow you to make more valuable decisions for your portfolio.

