To help investors keep up with the markets, we present our ETF Scorecard. The Scorecard takes a step back and looks at how various asset classes across the globe are performing. The weekly performance is from last Friday’s open to this week’s Thursday close.
- After two years of calmness, the European Union is again at the forefront of the financial world, with Italian politics taking center stage.
- Italian government bonds have declined abruptly after the country’s President Sergio Mattarella declined to accept the leading coalition’s finance minister on grounds he will take Italy out of the European Union. As a result, the prime minister selected by the populist union composed of Lega Nord and the Five Star Movement, Giuseppe Conte, had given up his mandate to form a government, throwing the country into fresh uncertainty. Late Thursday, however, the two leading parties convinced Conte to form a government and removed the controversial finance minister, enough to gain the approval of Mattarella.
- The U.S. and the European Union are on track to start a trade war in a tit-for-tat battle over tariffs. The U.S. Secretary of Commerce Wilbur Ross said the exemptions for the European Union, Canada and Mexico will end on June 1 and the country will start collecting levies on imports of aluminum and steel. The sides said they are preparing proportionate countermeasures, with the European Union targeting imports of jeans, Harley Davidson motorcycles and whiskey. Ross indicated that he is open to negotiating with the tariff-hit countries.
- April was a slow month for new durable goods orders. Compared to March, orders dropped by 1.7%, largely due to weak sales of transportation items. Excluding automobiles, orders grew by 0.9%.
- U.S. consumer confidence remains strong in May at 128, although a little below expectations. In a nasty surprise, consumer confidence for April was revised down to 125.6 from 128.7.
- Retail sales in Germany beat expectations by far, rising 2.3% in April month-over-month. Analysts had expected a modest rise of 0.5%.
- Germany’s preliminary consumer price index increased 0.5% in May, delivering a positive surprise. Forecasts pointed to 0.3% growth in CPI.
- ADP employment report disappointed estimates of 187,000, predicting that the U.S. economy created 178,000 jobs in May. In a further blow, the April data was revised down to 163,000 from 204,000.
- U.S. GDP rose 2.2% in the first quarter of the year, according to the second estimate of economic output. This is a tad lower than previously thought. Analysts correctly predicted the figure.
- Crude oil reserves dropped 3.6 million for the week ended May 25. The drop comes after the previous week’s stockpiles advanced by 5.8 million barrels.
Risk Appetite Review
- Markets have declined this week, with investors preferring safer assets in light of several global concerns, including free trade and Italian politics.
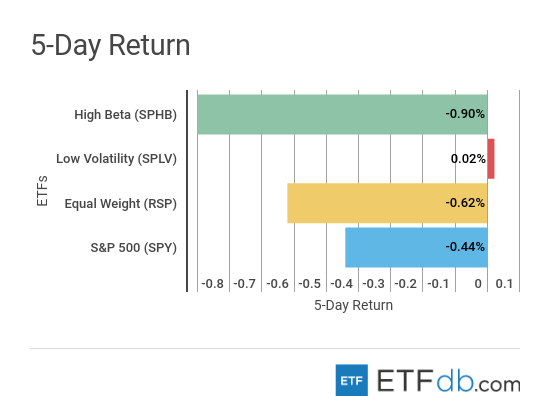
- Low volatility (SPLV ) is again the best performer, with a tepid advance of 0.02%, and the only gainer.
- Riskier assets (SPHB ), naturally, reported the biggest loss, down 0.90%.
- The broad market (SPY ) also dropped 0.44%.
Sign up for ETFdb.com Pro and get access to real-time ratings on over 1,900 U.S.-listed ETFs.
Major Index Review
- Major indexes posted mixed results.
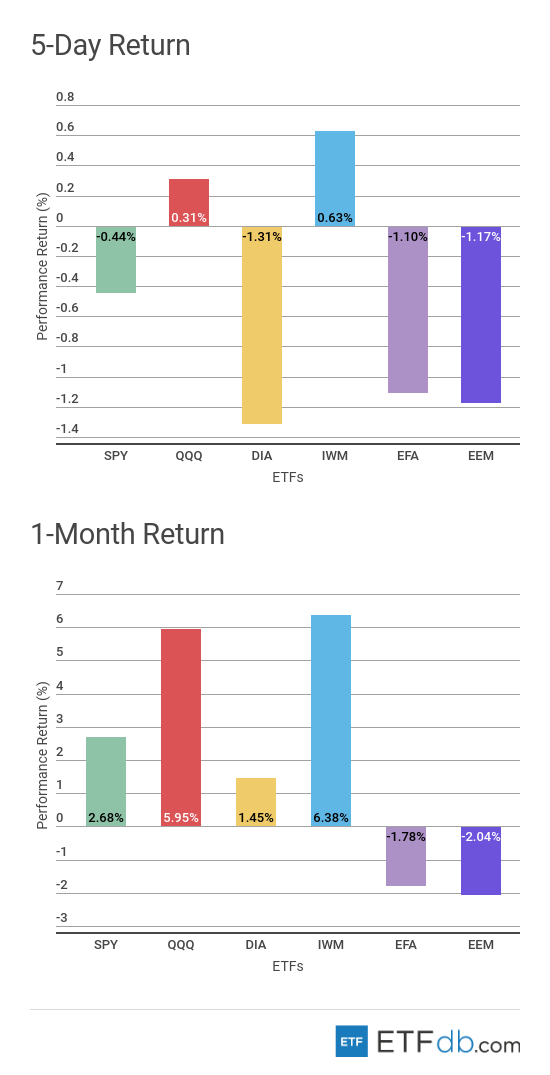
- Small-cap stocks (IWM ) were the best performers this week, rising by 0.63%, as investors believe the asset class is insulated from potential global trade and geopolitical shocks. (IWM ) is also the best performer for the rolling month, up 6.38%, with the index hovering near all-time highs.
- Dow Jones (DIA ) was the worst performer, declining by 1.31%, as its constituents have global businesses and are poised to suffer from a deterioration in trade relations.
- For the rolling month, emerging markets (EEM ) are the worst performers with a drop of more than 2%.
To see how these indices performed the week before last, check out ETF Scorecard: May 25 Edition
Sectors Review
- Sectors were mixed.
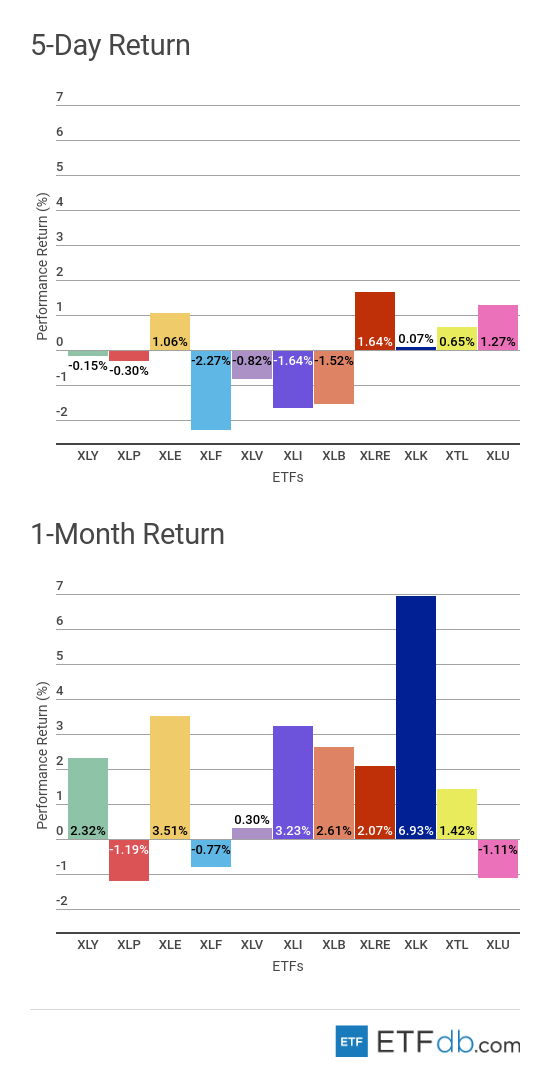
- The real estate industry (XLRE ) crept up 1.64% this week, representing the best performance from the pack.
- Financials (XLF ), meanwhile, dropped 2.27%, as a string of weak data in the U.S. decreased the likelihood of higher interest rates faster.
- For the rolling month, the technology sector (XLK ) posted the strongest results, rising nearly 7%, while consumer staples (XLP ) continued to disappoint, down 1.2%.
Use our Head-to-Head Comparison tool to compare two ETFs such as (XLRE ) and (XLK ) on a variety of criteria such as performance, AUM, trading volume and expenses.
Foreign Equity Review
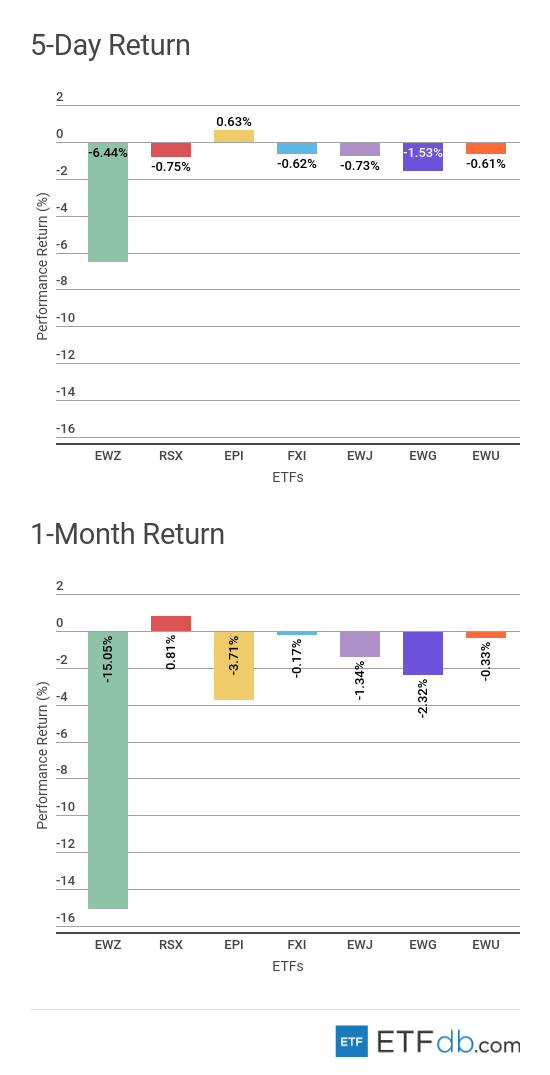
- Foreign equities were all down with a few exceptions.
- Brazil (EWZ ) staged the worst losses for the week, declining by 6.44%, as fears that the government will fail to quell a series of strikes have increased. (EWZ ) is also the worst performer for the rolling month by far, down 15%.
- Amid global uncertainty, India (EPI ) managed to deliver the surprise this week, rising by 0.63%.
- Russia (RSX ) remains the best monthly performer with an advance of 0.81% on the back of strong oil prices.
To find out more about ETFs exposed to particular countries, use our ETF Country Exposure tool. Select a particular country from a world map and get a list of all ETFs tracking your pick.
Commodities Review
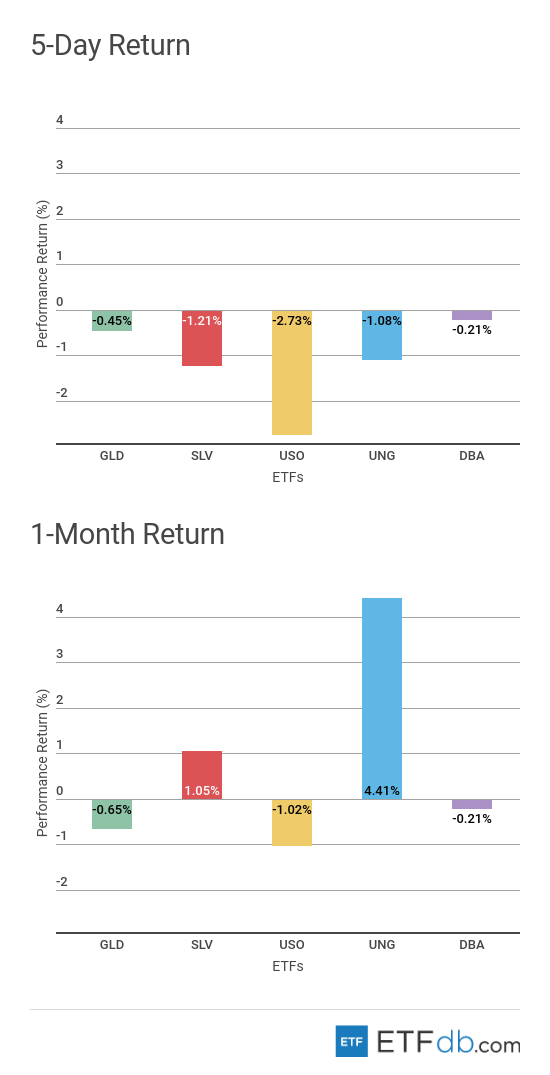
- Commodities were all down this week.
- The Agriculture fund (DBA ) fell the least in the past five days, while oil (USO ) was the worst performer with a fall of 2.73%. Oil started to reverse gains after Saudi Arabia signaled it may agree with Russia to increase production to make up for the Venezuelan supply cuts. Oil is also the worst performer for the rolling month, down more than 1%.
- For the rolling month, natural gas (UNG ) is the best performer with an advance of 4.41%.
Currency Review
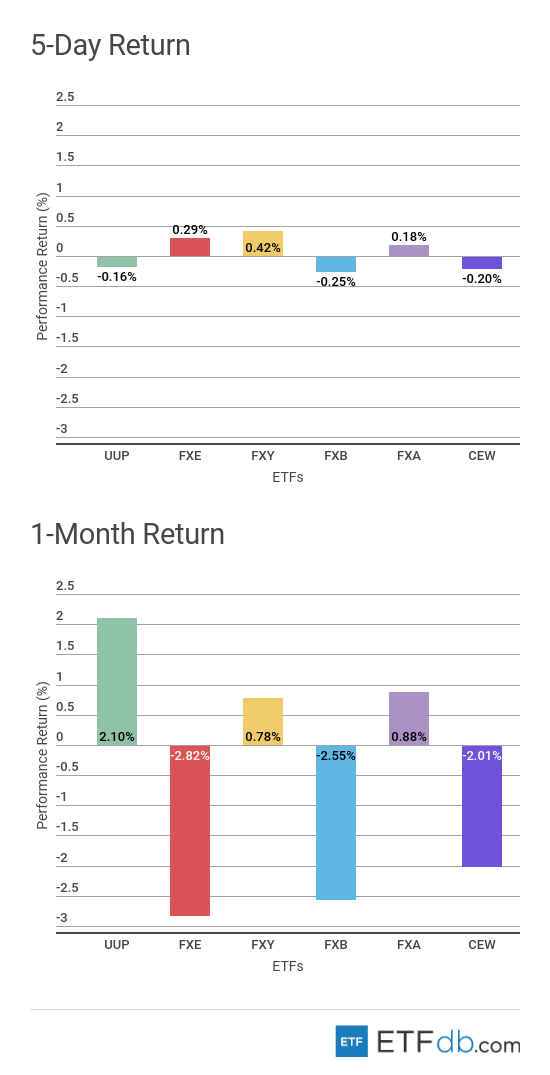
- The Japanese yen (FXY ) posted the strongest gain among currencies this week, tepidly edging up 0.42%.
- For the rolling month, the U.S. dollar (UUP ) remains king with an increase of 2.1%.
- The British pound (FXB ) fell 0.25% for the past five days, representing the worst performance.
- Battered by a renewed political crisis in Italy, euro (FXE ) is the worst monthly performer, down 2.82%.
For more ETF news and analysis, subscribe to our free newsletter.