
To help investors keep up with the markets, we present our ETF Scorecard. The Scorecard takes a step back and looks at how various asset classes across the globe are performing. The weekly performance is from last Friday’s open to this week’s Thursday close.
- The Bank of Japan, U.S. Federal Reserve and Bank of England have all issued updates on their monetary policies, but only the latter stirred interest in the market.
- Bank of England has raised interest rates for the second time this year and decade – from 0.50% to 0.75%. Governor Mark Carney said further rate rises will be limited and gradual and did not rule out making cuts if Brexit takes a nasty turn.
- The U.S. Federal Reserve has kept interest rates unchanged at 2%, but economists expect the central bank to make at least two other moves this year.
- In a widely expected move, the Bank of Japan held its massive stimulus unchanged, but adopted forward guidance for the first time saying it would keep low rates for an extended period of time. The objective of the forward guidance was in part to squash speculations that the bank was about to end its stimulus program
- The U.S. economy is showing signs of growing strength, with second-quarter GDP rising 4.1%. This is the best figure in nearly four years, although it did match analyst estimates.
- Further adding to the bright picture, consumer sentiment rose to 97.9 in July, comfortably beating expectations of 97.1.
- European CPI rose 2.1% in July, higher than expectations of 2%. Inflation is now running above the ECB’s target but the rise is chiefly due to higher energy prices, up 9.4% in July. Core CPI, which excludes volatile items such as energy and alcohol, rose 1.1%, while the figure for the prior month was revised down to 0.9%.
- The U.S. economy added 219,000 jobs in July, beating expectations of 186,000 and up compared to 181,000 in the prior 30-day period, according to ADP.
- Crude oil inventories increased 3.8 million barrels for the week ended July 27, reversing from a drop of 2.6 million in the previous week.
Risk Appetite Review
- This week the stock market was in correction mode as a string of disappointing earnings gave investors food for thought.
- Low volatility (SPLV ) is the best performer from the pack with a small decline of 0.18%.
- High beta (SPHB ) was the index that felt the most heat, dropping 1.80% in the past five days.
- The broad market (SPY ) registered a 0.47% drop.
Sign up for ETFdb.com Pro and get access to real-time ratings on over 1,900 U.S.-listed ETFs.

Major Index Review
- Major indexes were all down.
- Emerging markets (EEM ) declined 2.21% for the week, as a trade war between China and the U.S. has intensified. President Donald Trump asked his trade representatives to slap 25% tariffs on $200 billion worth of goods instead of 10% as previously envisaged.
- The S&P 500 (SPY ) acted as an unlikely safe haven, losing only 0.47% of its value in the past week.
- For the rolling month, Dow Jones (DIA ) remains the king after posting the best performance in the prior five-day period.
- Small-cap stocks (IWM ) are the worst monthly performers, with the ETF registering a gain of merely 1.35%.
To see how these indices performed a week before last, check out ETF Scorecard: July 27 Edition

Sectors Review
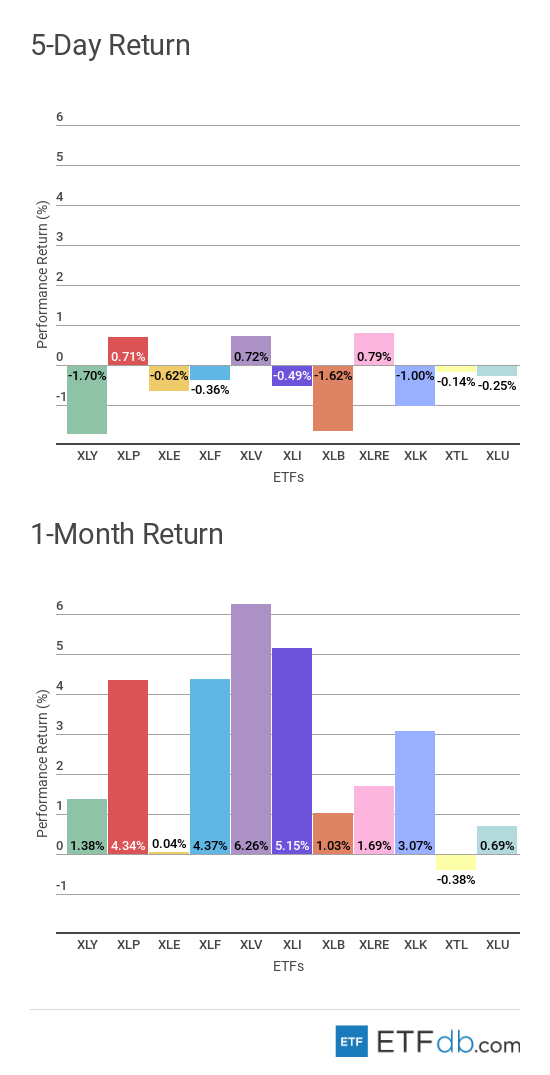
- Sectors posted mixed performance.
- The real estate sector (XLRE ) erased some of the losses recorded in previous weeks and is now the best performer, up 0.79%.
- The consumer discretionary sector (XLY ) took another hit this week, falling 1.70%.
- For the rolling month, the healthcare sector (XLV ) increased 6.26%, representing the best performance from the pack.
- The telecom sector (XTL ) is the only faller for the month, down 0.38%, as massive investments in 5G technology are expected to hit the companies’ bottom lines.
Use our Head-to-Head Comparison tool to compare two ETFs such as (XTL ) and (XLRE ) on a variety of criteria such as performance, AUM, trading volume and expenses.
Foreign Equity Review
- Foreign equities were all down with one exception.
- Chinese equities (FXI ) are again the biggest losers this week as a trading war with the U.S. threatens to destabilize the economy. (FXI ) is down 3.17%.
- India (EPI ), meanwhile, is the only riser from the bunch, up 1.68%, as the country’s stock market is a relative safe haven in the ongoing trade spat between China and the U.S. India’s domestic demand is rising but an increase in oil prices may dampen consumer sentiment.
- Brazilian equities (EWZ ) remain the best performers for the past 30 days, surging as much as 12.27%.
- British equities (EWU ) are the worst monthly performers, down 1.12%.
To find out more about ETFs exposed to particular countries, use our ETF Country Exposure tool. Select a particular country from a world map and get a list of all ETFs tracking your pick.

Commodities Review
- Commodities were all down with a few exceptions.
- Despite a small market selloff, investors are not rushing to buy gold as a safe haven. Gold (GLD ) is the worst weekly performer for two consecutive weeks, this time falling 1.21%.
- U.S. natural gas (UNG ) is the only gainer for the week, up 1.14%, and the best performer for the rolling month with a loss of 0.52%.
- Crude oil (USO ) has plummeted 5.46% in the past 30 days, erasing some of the gains posted in previous months.

Currency Review
- Currencies were mixed.
- The U.S. dollar (UUP ) is the king both for the week and the rolling month, rising 0.44% and 0.60%, respectively, thanks to a string of positive economic data.
- Emerging market currencies (CEW ) are on the other side of the performance spectrum, falling 0.69% for the week.
- The British pound (FXB ) is the worst performer for the rolling month, down 1.17%, as chances of a no-deal Brexit are high.

For more ETF analysis, make sure to sign up for our free ETF newsletter.
Disclosure: No positions at time of writing.

