
To help investors keep up with the markets, we present our ETF Scorecard. The Scorecard takes a step back and looks at how various asset classes across the globe are performing. The weekly performance is from last Friday’s open to this week’s Thursday close.
- U.S. President Donald Trump has received the hardest blow to his mandate yet, after his former lawyer Michael Cohen pleaded guilty to a series of campaign finance violations. Critically, Cohen admitted that some of the wrongdoing was made at the instruction of an election candidate, without naming Trump himself. Meanwhile, Trump’s former campaign manager was found guilty of bank and tax fraud. The possibility of impeachment has increased, with Trump himself saying the stock market would crash if he was impeached.
- U.S. Federal Reserve has hinted it will raise interest rates again if the economy maintains the current growth clip and stays healthy, according to minutes for the last meeting. However, central bankers made clear they are monitoring the risks related to the trade dispute between the U.S. and China.
- The European Central Bank, meanwhile, is worried about trade war and protectionism, but agreed that the economy was performing as expected, making unnecessary any further changes to monetary policy.
- U.S. consumer sentiment continued to head down, posting its third consecutive decline in August, down to 95.3 from 97.9 previously. Analysts had expected a strong showing of 98.1.
- The U.S. housing market is showing signs of weakness, with existing home sales dropping for the fourth straight month. Sales fell 0.7% to 5.34 million units in July, marking the longest series of declines since 2013.
- New home sales for July dropped to 627,000 from a revised 638,000, disappointing analyst estimates of 643,000.
- Crude oil inventories have again reversed to declines after a strong rise the prior week. For the five-day period ended August 17, U.S. stockpiles dropped 5.8 million barrels, compared to a jump of 6.8 million previously.
- A multitude of European services and manufacturing indexes painted a mixed picture of the economic sentiment. The Europe-wide manufacturing purchasing managers’ index dropped to 54.6 in August from 55.1 in the prior month. Services PMI, meanwhile, rose to 54.4 from 54.2.
Risk Appetite Review
- The stock market maintained its pace of gains this week, with the bull run now the longest in history.
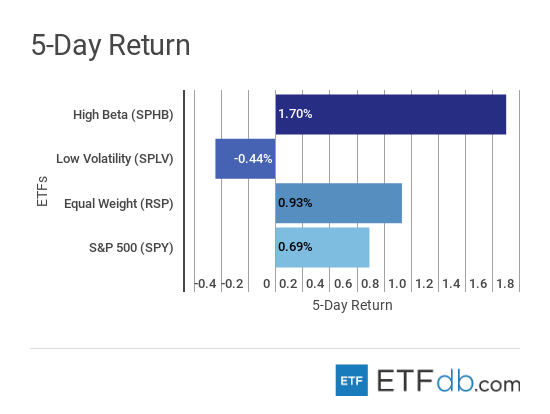
- The broad market (SPY ) rose 0.69% this week, but shed some of the gains on Tuesday and Wednesday.
- Risky assets (SPHB ) were in vogue, with investors bidding the stocks up 1.70%, which was by far the best performance of the week.
- Low volatility (SPLV ) was the only loser with a drop of 0.44%.
Sign up for ETFdb.com Pro and get access to real-time ratings on over 1,900 U.S.-listed ETFs.
Major Index Review
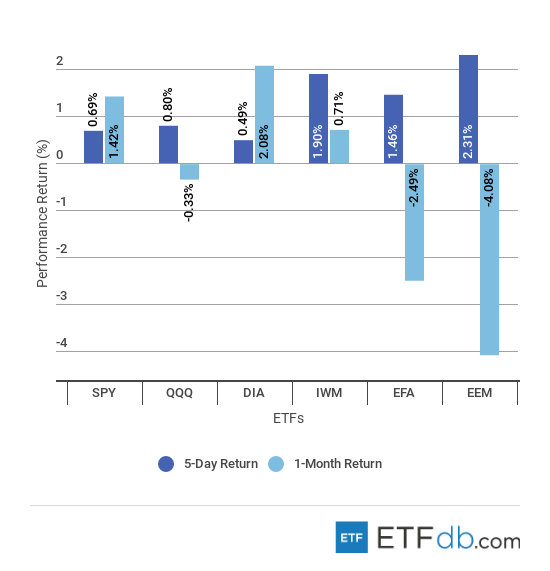
- Major indexes were all up.
- Emerging markets (EEM ) reversed some of their losses stemmed from a trade war between China and the U.S., as well as an ongoing spat between the U.S. and Turkey. As a result, (EEM ) is the best performer for the week, up 2.31%, and the worst performer for the month, down 4.08%.
- Dow Jones (DIA ) is the worst performer for the week, with a rise of 0.49%, but the blue-chip index is up more than 2% for the rolling month, representing the best performance.
To see how these indices performed a week before last, check out ETF Scorecard: August 17 Edition.
Sectors Review
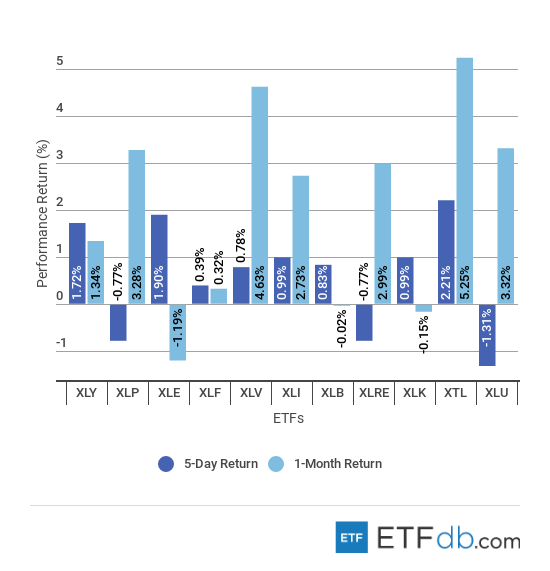
- In a market that is embracing risk, utilities (XLU ) posted the worst weekly performance, falling 1.31%.
- Telecom equities (XTL ) have had a solid run of late, becoming the best performers both for the week and the rolling month.
- The energy sector (XLE ) dropped 1.19% for the past 30 days, representing the worst performance.
Use our Head-to-Head Comparison tool to compare two ETFs such as (XLE ) and (XTL ) on a variety of criteria such as performance, AUM, trading volume and expenses.
Foreign Equity Review
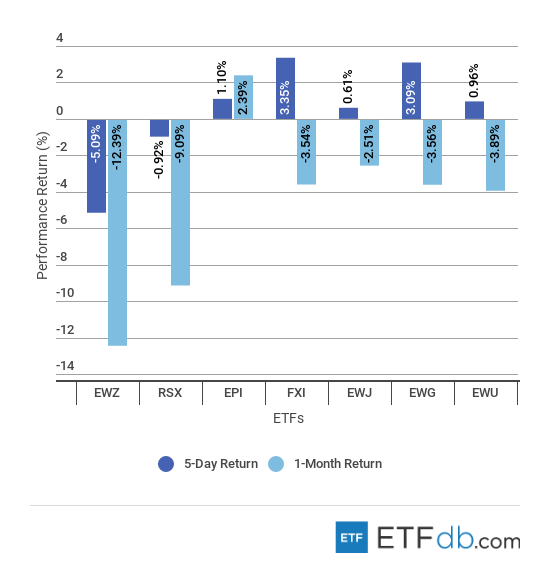
- Brazilian stocks (EWZ ) have been volatile this past week, dropping more than 5% on worries about the country’s presidential race. Latest polls show that the centrist, market-friendly candidate Geraldo Alckmin is trailing third. (EWZ ) is also the worst performer for the rolling month, losing 12.39% of its value.
- Chinese stocks (FXI ) have rallied 3.35% this week as investors hope for a thaw between China and the U.S. over trade. Discussions between officials of both countries is likely to take place this week, although it is unclear whether they would lead to substantial progress.
- India’s stocks (EPI ) advanced the most for the rolling month, up 2.39%.
To find out more about ETFs exposed to particular countries, check out our ETF Country Exposure Tool. Select a particular country from a world map and get a list of all ETFs tracking your pick.
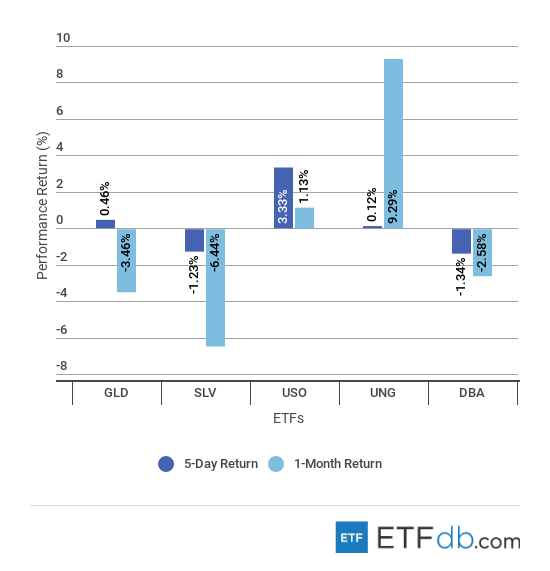
Commodities Review
- Commodities were mixed.
- Crude oil (USO ) was by far the best performer for the week, surging 3.33%, as U.S. inventories registered a big drawdown this week.
- The Agricultural ETF (DBA ) fell 1.34% in the past five days, the worst performance.
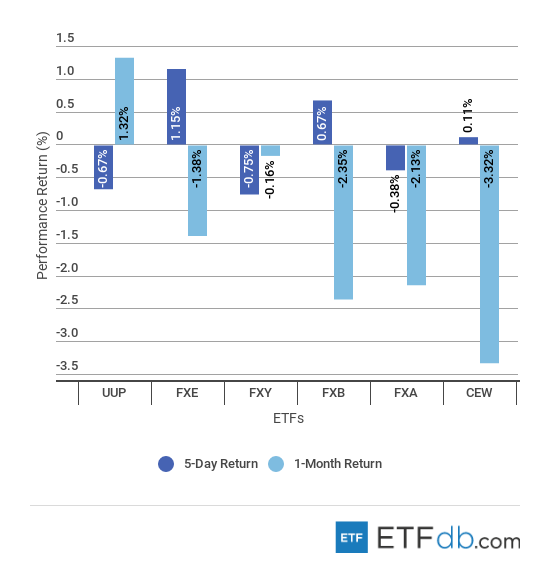
Currency Review
- Currencies posted mixed results.
- The U.S. dollar (UUP ) lost 0.67% this week, largely after Donald Trump’s comments that Europe and China are manipulating their currency markets. For the rolling month, however, the greenback was the only currency that posted gains, up 1.32%.
- The Japanese yen (FXY ) fell 0.75% this week as investors favored riskier assets.
- The European shared currency (FXE ) advanced the most this week, up 1.15%, largely thanks to the comments made by President Trump.
- Emerging market currencies (CEW ) lost 3.32% for the rolling month, largely due to heavy losses posted by the Turkish lira.
For more ETF analysis, make sure to sign up for our free ETF newsletter.
Disclosure: No positions at time of writing.

