
News
To help investors keep up with the markets, we present our ETF Scorecard. The Scorecard takes a step back and looks at how various asset classes across the globe are performing. The weekly performance is from last Friday’s open to this week’s Thursday close.
- A Brexit withdrawal treaty is much more likely to be achieved after Germany dropped its demand to have a future trade deal in place before the March 29 deadline. This means that chief aspects of the post-Brexit relationship between Britain and Europe will be negotiated later, during the two-year transition period.
- Emerging markets have moved into bear market territory this week, raising the prospects of contagion into developed markets.
- European inflation dropped to 2% in August from 2.1% in the prior month, hitting the European Central Bank’s target. But the ECB is not in a hurry to tighten monetary policy as core inflation hovers around 1%. The rise in inflation is largely due to higher energy prices, a temporary effect.
- British manufacturing PMI declined to 52.8 in August from 53.8 as fears of a no-Brexit deal has weighed on sentiment. The index reached a two-year low, with such levels not seen since the Brexit referendum vote.
- Meanwhile, British services PMI improved to 54.3 in August from 53.5. Analysts had expected a figure of 53.9.
- In the U.S., ISM’s manufacturing sentiment hit 61.6, a level not seen since March 2011, in a sign that the U.S. economy is firing on all cylinders. Analysts had forecasted a rise of 57.6.
- U.S. non-manufacturing PMI surged to 58.5 from 55.7, but the index is still lower compared to July.
- ADP forecasted the U.S. economy added 163,000 jobs in August, down from a revised 217,000 in July and lower compared with 195,000 forecasted by analysts.
- Crude oil inventories continued their drop this week, the third in a row. U.S. stockpiles dropped 4.3 million.
Risk Appetite Review
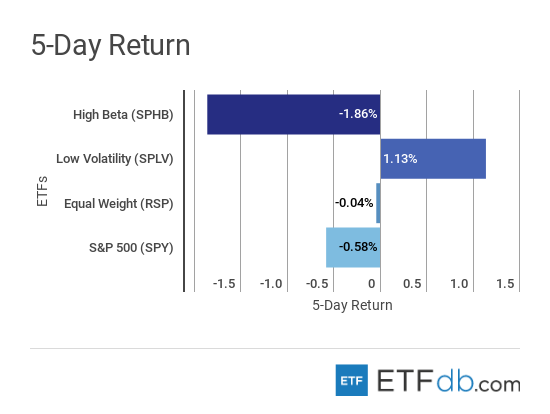
- Risk assets (SPHB ) had a bad week amid fears of contagion from an emerging markets selloff. (SPHB ) dropped 1.86%, the worst performance from the pack.
- Low volatility assets (SPLV ) were in vogue, rising 1.13%.
- The broad market (SPY ) declined 0.58%.
- Sign up for ETFdb.com Pro and get access to real-time ratings on over 1,900 U.S.-listed ETFs.
Content continues below advertisement
Major Index Review
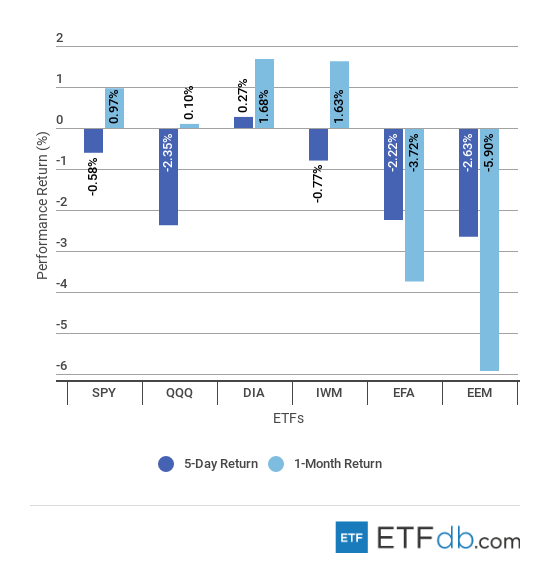
- Major indexes were all down with one exception.
- Unsurprisingly, emerging markets (EEM ) were hit the most, shedding 2.63% of their value in the past five days. A strong dollar combined with rising U.S. interest rates and American protectionism has deteriorated emerging markets’ prospects. Emerging markets are also the worst performers for the rolling month, down 5.9%.
- At the other end of the spectrum is blue-chip index Dow Jones (DIA ), which rose 0.27%. Investors were allured by the index’s relative safety. (DIA ) is also the best monthly performer, up 1.68%.
- To see how these indices performed a week before last, check out ETF Scorecard: August 31 Edition.
Sectors Review
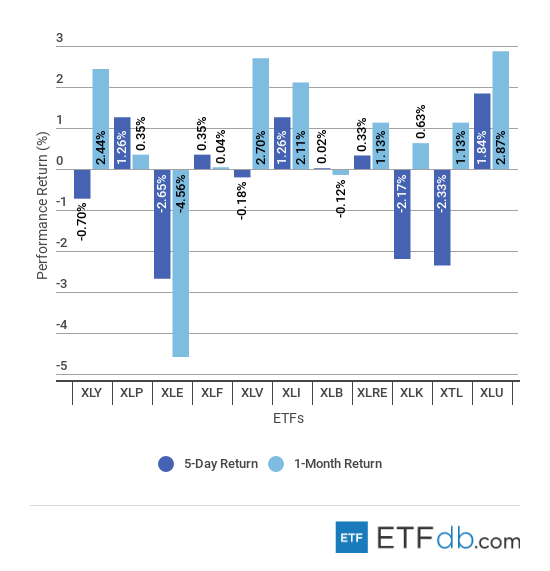
- Dragged down by oil and natural gas, the energy sector (XLE ) is the worst performer for the week with a decline of 2.65%. Combined with losses posted in previous weeks, (XLE ) became the worst performer for the rolling month as well, down 4.56%.
- Utilities (XLU ) are up 1.84% for the week, beating all other sectors, as investors sought safe-haven assets. (XLU ) is also the best monthly performer with a rise of 2.87%.
- Use our Head-to-Head Comparison tool to compare two ETFs such as (XLE ) and (XLU ) on a variety of criteria such as performance, AUM, trading volume and expenses.
Foreign Equity Review
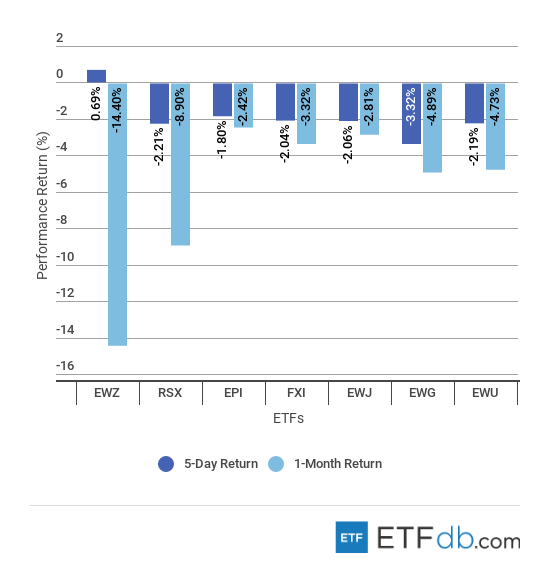
- Foreign markets are almost all down.
- Brazil (EWZ ) managed to deliver the surprise, advancing 0.69% for the week, the only asset to post gains. Yet Brazil is no safe haven. (EWZ ) remains the worst monthly performer, tumbling as much as 14.4%.
- Germany (EWG ) is decidedly the worst performer for the week, down 3.32%, amid a selloff in most foreign markets.
- India (EPI ) is the best monthly performer, dropping just 2.42%.
- To find out more about ETFs exposed to particular countries, use our ETF Country Exposure tool. Select a particular country from a world map and get a list of all ETFs tracking your pick.
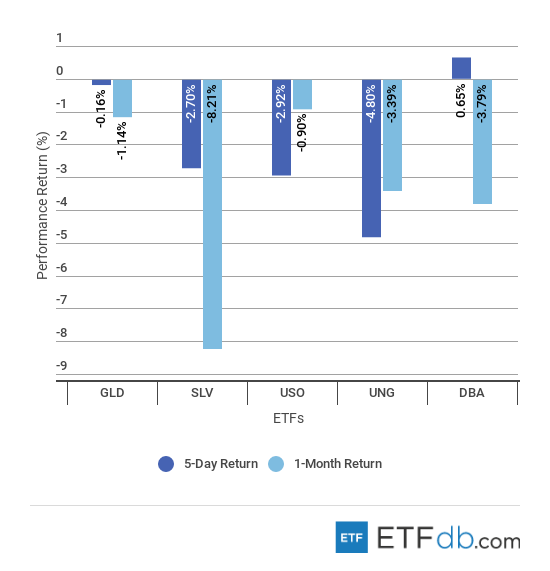
Commodities Review
- Commodities were mostly in the red.
- The agricultural fund (DBA ) acted as a safe haven in a deep selloff, rising 0.65% for the week.
- Natural gas (UNG ), meanwhile, is down 4.80% despite a U.S. inventory report that was in line with expectations.
- Silver (SLV ) remains the worst monthly performer, declining as much as 8.21%.
- Thanks to strong gains in previous weeks, crude oil (USO ) posted the strongest performance for the rolling month, still dropping 0.90%.
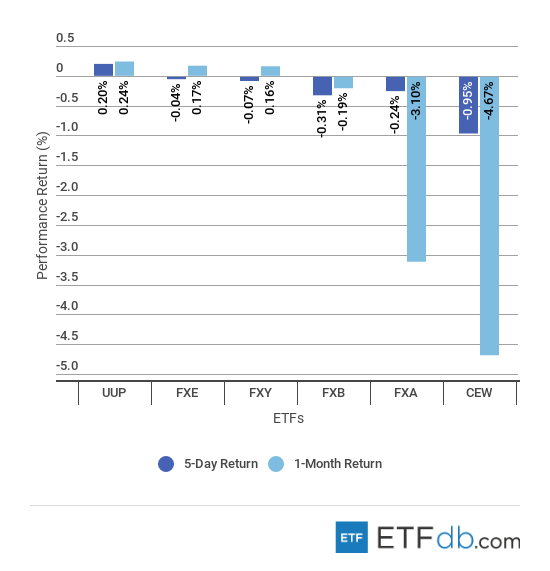
Currency Review
- Currencies were all down, except the U.S. dollar.
- The U.S. dollar (UUP ) has advanced 0.20% for the week, extending monthly gains to 0.24%. A strong U.S. economy has increased bets that the Federal Reserve will hike interest rates at a faster pace than previously expected.
For more ETF analysis, make sure to sign up for our free ETF newsletter.
Disclosure: No positions at time of writing.

