
News
To help investors keep up with the markets, we present our ETF Scorecard. The Scorecard takes a step back and looks at how various asset classes across the globe are performing. The weekly performance is from last Friday’s open to this week’s Thursday close.
- As Labor Day approaches and investors return from vacation, markets could not be in a more positive mood despite threats across the board.
- U.S. President Donald Trump is planning to impose an additional round of tariffs on Chinese imports as soon as a public-comment period ends on September 6. Around $200 billion worth of Chinese goods will be subjected to U.S. levies, around four times more than the current figure of $50 billion. A final decision has not yet been made and tariffs could be implemented in installments.
- Amid a trade war escalation, U.S. GDP grew by 4.2% in the second quarter, up from the previous estimate of 4%.
- U.S. Federal Reserve Chair Jerome Powell said in a speech at the Jackson Hole Symposium that he backs a gradual normalization of monetary policy, despite some fearing that the Fed is moving too slowly. He made clear that the central bank would move decisively in a crisis.
- Meanwhile, core durable goods orders rose 0.2% in July, while the figure for the prior month was revised down from growth of 0.5% to 0.2%. Analysts had expected a showing of 0.5%.
- Sentiment among German businesses has improved consistently in August, with the German Institute for Economic Research’s business climate index rising to 103.8 in August from 101.7.
- U.S. consumer confidence surged to 133.4 in August, well above expectations of 126.6.
Crude oil inventories continued their decline in the week ended August 24. Stockpiles dropped by 2.6 million, above analysts’ expectations of 0.7 million.
- U.S. unemployment claims rose by 3,000 in the week ended August 25 to 213,000, but are still hovering near record lows.
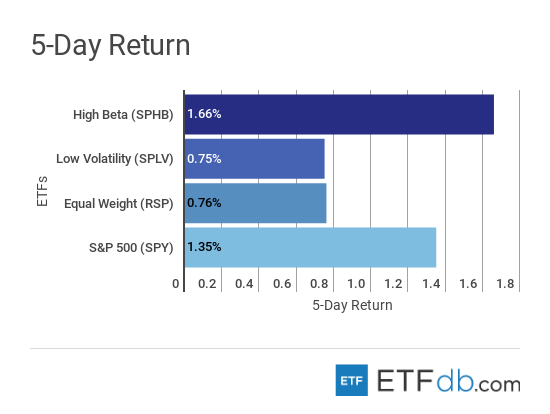
Risk Appetite Review
- August is almost over and the stock market is hovering near record highs on the back of a strong U.S. economy.
- Riskier assets (SPHB ) were again favored by investors, edging up 1.66% in the five days through Thursday.
- The broad market itself (SPY ) posted solid gains of 1.35%.
- Low volatility (SPLV ) is the worst performer in the category, up just 0.75% this week.
- Sign up for ETFdb.com Pro and get access to real-time ratings on over 1,900 U.S.-listed ETFs.
Content continues below advertisement
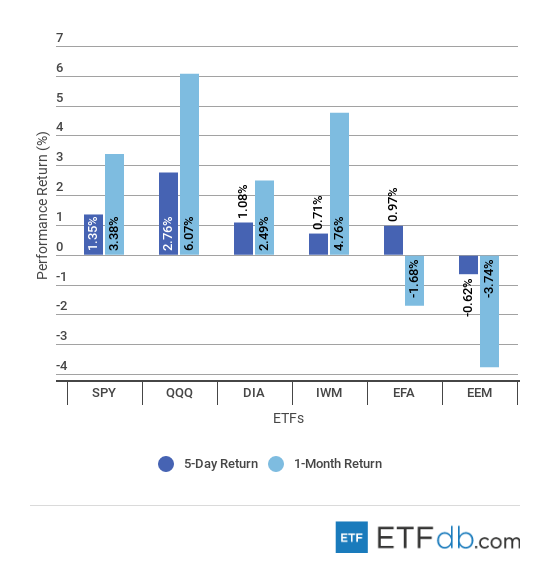
Major Index Review
- Major indexes were all up with one exception.
- Technology stocks (QQQ ) powered ahead this week, rising 2.76% thanks to a recovery posted by Netflix (NFLX) and other technology giants. The weekly gains propelled (QQQ ) to record highs and the best performer status for the past 30 days, up more than 6%.
- Emerging markets (EEM ) is the only asset that recorded losses for the week, down 0.62%, amid chaos in Turkey and an intensification of the trade war between China and the U.S. Unsurprisingly, (EEM ) is also the worst performer for the rolling month, down more than 3%.
- To see how these indices performed a week before last, check out ETF Scorecard: August 24 Edition
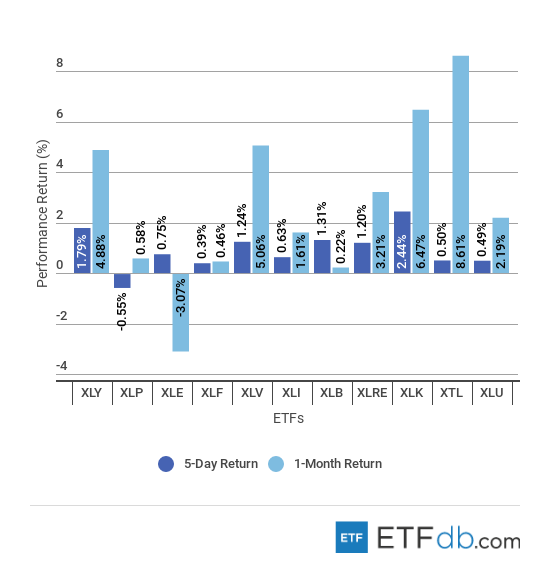
Sectors Review
- As expected, technology equities (XLK ) are the best performers among sectors, but only for the past five days.
- With a gain of 8.61%, telecom equities (XTL ) posted the best performance for the rolling month.
- Consumer staples (XLP ) continued to decline this week amid a tough environment stemmed from competition from Amazon and other online retailers. The only faller, (XLP ) dropped 0.55% this week.
- For the rolling month, the energy sector (XLE ) is the worst performer with a decline of more than 3%.
- Use our Head-to-Head Comparison tool to compare two ETFs such as (XLE ) and (XTL ) on a variety of criteria such as performance, AUM, trading volume and expenses.
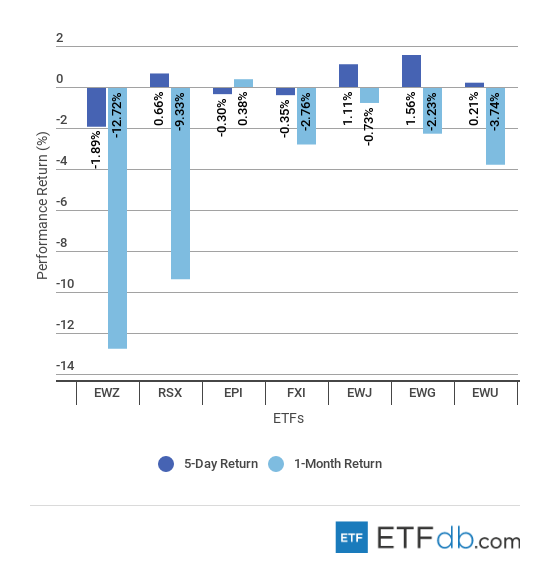
Foreign Equity Review
- The performance picture in foreign markets is decidedly mixed.
- Brazilian stocks (EWZ ) fell 1.9% in the past five days, extending monthly losses to as much as 12.72%. The poor performance comes as the country is preparing for a presidential election, which is unlikely to be won by the market-friendly candidate.
- Germany (EWG ), meanwhile, managed to gain 1.56% for the week, trimming monthly losses to 2.23%.
- For the rolling month, the best performer and the only gainer is India (EPI ), which posted a tepid rise of 0.38%.
- To find out more about ETFs exposed to particular countries, use our ETF Country Exposure tool. Select a particular country from a world map and get a list of all ETFs tracking your pick.
Commodities Review
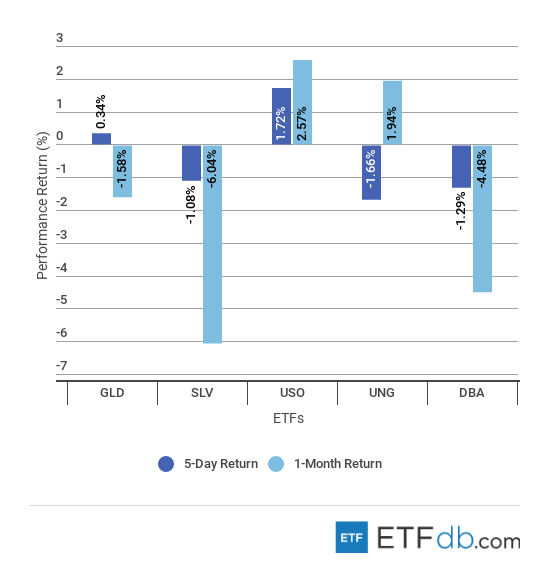
- Commodities were mostly in the red.
- Crude oil (USO ) was the best performer both for the week and the rolling month, up 1.72% and 2.57%, respectively, as U.S. stockpiles continue to decline.
- Natural gas (UNG ) fell 1.66% in the five days through Thursday.
- For the rolling 30 days, silver (SLV ) is the worst performer with a big decline of more than 6%.
Currency Review
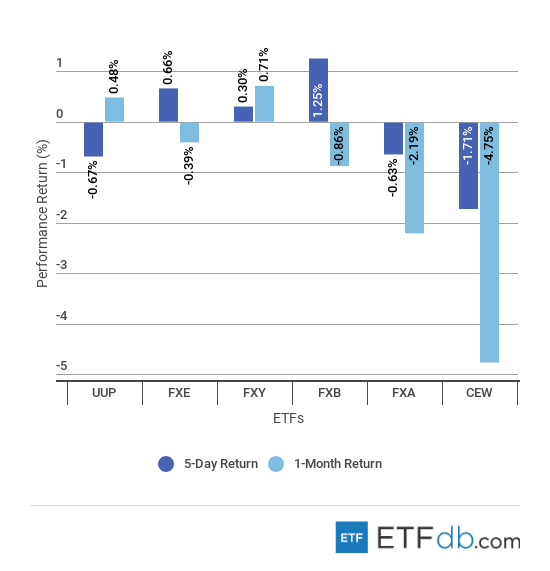
- Currencies posted mixed results.
- The British pound (FXB ) has gained 1.25% this week, starting to reverse losses posted in the previous weeks. Traders have become more optimistic about the prospect of a Brexit deal, after policymakers in Europe and Britain indicated that an agreement was likely.
- The Japanese yen (FXY ) is the strongest performer for the rolling month with a rise of 0.71%.
- Emerging markets currencies (CEW ) are the worst performers both for the week and the rolling month, down 1.71% and 4.75%, respectively.
For more ETF analysis, make sure to sign up for our free ETF newsletter.
Disclosure: No positions at time of writing.

