
News
To help investors keep up with the markets, we present our ETF Scorecard. The Scorecard takes a step back and looks at how various asset classes across the globe are performing. The weekly performance is from last Friday’s open to this week’s Thursday close.
- The European Central Bank has held the benchmark interest rate unchanged. It also signaled it would end its unprecedented bond-buying program at the end of the year but keep interest rates at record-low levels at least through mid-2019.
- At last, there are signs that a tight U.S. labor market is translating into higher wages. In August, the U.S. economy added 201,000 jobs, beating forecasts of 191,000. Meanwhile, the jobs figures for the prior month were revised down by 10,000 to 147,000. One particularly bright spot is hourly wages, up 0.4% month-over-month compared to forecasts of 0.2%. Year-over-year, wages increased by as much as 2.9%.
- The unemployment rate remained flat at 3.9%, although analysts had expected a drop to 3.8%.
- The Bank of England held interest rates unchanged at 0.75% but warned of increasing signs of stress over a potential no-deal Brexit. Continuous trade frictions with the European Union after the country’s withdrawal from the bloc is dampening sentiment. On the bright side, the economic picture has improved.
- U.K. GDP rose 0.6% in the three months to July from 0.4% in the prior month, in no small part due to a buoyant services sector as summer heat and the England soccer team reaching World Cup semi-finals boosted demand for services.
- Germany’s ZEW economic sentiment improved from negative 13.7 to negative 10.6 in September, although that still does not bode well for the economy. The sentiment has been below zero for six consecutive months, the longest negative streak since mid-2012.
- Strong demand for crude oil has led to the fourth consecutive weekly drop in inventories. For the week ended September 13, stockpiles fell by 5.3 million, the highest decline in three weeks.
- The U.S. consumer price index advanced 0.2% in August following a similar gain in the prior month. Year-over-year, inflation rose 2.7%, down from 2.9% in July.
Risk Appetite Review
- The broad market (SPY ) plowed ahead this week, becoming the top performer from the pack, amid strong economic figures. (SPY ) advanced 1.34% in the five days through Thursday.
- Low volatility (SPLV ) was the worst performer for the week, up only 0.66%.
- Sign up for ETFdb.com Pro and get access to real-time ratings on over 1,900 U.S.-listed ETFs.
Content continues below advertisement

Major Index Review
- Major indexes were mostly up this week.
- Technology stocks (QQQ ) performed the best this week, advancing as much as 2.22%, as Apple (AAPL) unveiled its latest set of products.
- Small-cap equities (IWM ) gained the least this week, up just 0.26%.
- For the rolling month, Dow Jones (DIA ) remains the best performer, as the index benefited from its safe-haven status in recent weeks.
- Emerging markets (EEM ) recorded a small gain for the week, but that was not enough to erase monthly losses, which stand at 1.5%.
- To see how these indices performed a week before last, check out ETF Scorecard: September 7 Edition.

Sectors Review
- Financial stocks (XLF ) were the only losers this week, down 1.37% for no apparent reasons. The approach of the ten-year anniversary of the collapse of Lehman Brothers may have revived negative memories for investors in the financial sector.
- Technology equities (XLK ) advanced 2.25% for the week ended Thursday, the best performance from the pack.
- For the rolling month, the industrial sector (XLI ) rose nearly 5%, while energy stocks (XLE ) dropped 1.4% on falling gas prices.
- Use our Head-to-Head Comparison tool to compare two ETFs such as (XLF ) and (XLK ) on a variety of criteria such as performance, AUM, trading volume and expenses.

Foreign Equity Review
- After a short respite, Brazil (EWZ ) is again the worst performer for the week, down as much as 5.77% as a presidential election is fast-approaching. According to the polls, the market-friendly candidate Geraldo Alckmin has a small chance of getting elected. (EWZ ) is also the worst performer for the rolling month, down nearly 11%.
- Russia (RSX ) surged 3.53% for the week ended Thursday, representing the best performance.
- Germany (EWG ) is the best performer for the rolling month with a tepid gain of 0.57%.
- To find out more about ETFs exposed to particular countries, use our ETF Country Exposure tool. Select a particular country from a world map and get a list of all ETFs tracking your pick.

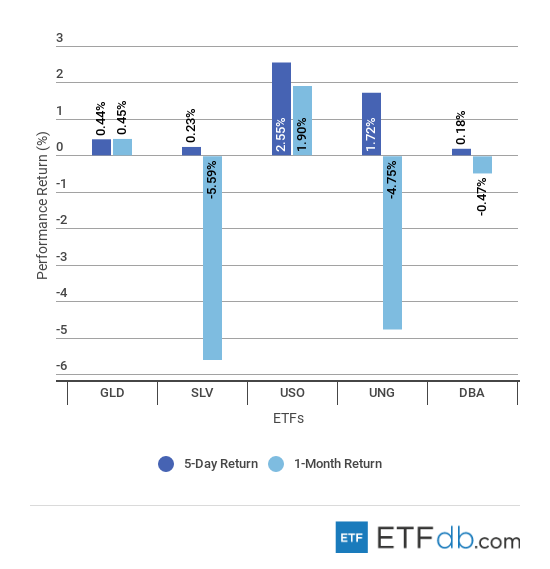
Commodities Review
- Oil (USO ) continued its rally into this week, jumping 2.55% as demand for the commodity is strong judging by the falling U.S. stockpiles. (USO ) is also the best performer for the rolling month, up 1.9%.
- The Agricultural fund (DBA ) rose just 0.18% in the five days through Thursday, the smallest gain from the pack.
- Silver (SLV ) remains the worst performer for the rolling month, down as much as 5.59%.
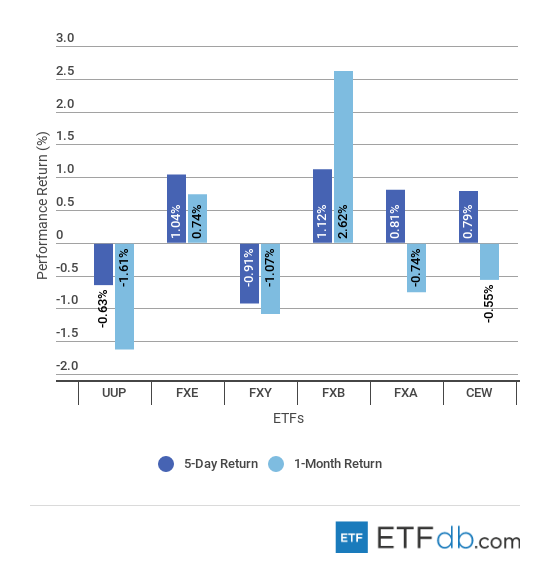
Currency Review
- The British pound (FXB ) is the best performer both for the week and the rolling month, up 1.12% and 2.62%, respectively, as investors cheered the prospects of a Brexit deal between the EU and the U.K.
For more ETF analysis, make sure to sign up for our free ETF newsletter.
Disclosure: No positions at time of writing.

