
A sharp rise in the yield of benchmark 10-year U.S. Treasury notes sparked a sell-off in stocks that circled global markets.
Debt markets are under pressure with bond prices falling rapidly, prompting investors to head toward products like inverse bonds ETFs for a piece of the pie. Japanese companies have not been spared the rout and fell to a four-week low, while crude oil traded near 4-year highs due to a plunge in Iranian exports as a result of U.S. sanctions. Closing the list, Canadian assets were favored last week on news regarding the rescue of the trilateral North American Free Trade Agreement but did not enjoy the highly anticipated inflows for long.
Check out our previous Trends edition at Trending: Communication Stocks in Spotlight Amid S&P Sector Reshuffle.
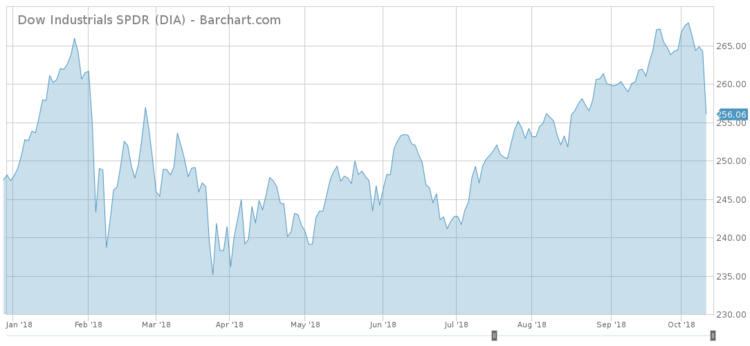
Dow Jones Takes a Hit From 7-Year High Rates, Trade Woes
The yield in benchmark 10-year Treasury notes crept up just shy of 3.26%, the highest level since May 2011. Rising input costs sparked a wave of selling in financial markets, with the Dow Jones shedding 830 points on Wednesday alone. The turbulence around world exchanges drove up traffic in the major stock indices sector by 64% over the last week.
When it comes to yields, analysts and investors alike are focusing on pace more than the level itself. That said, the 3.25% touched last Thursday after a 16 basis point upward move in just two days is alarming for market participants because it offers a glimpse into the future of indebted companies. Rising interest rates are also a drag as they are driving the greenback higher, thus adding to trade concerns and forming a gloomy picture for earnings guidance of U.S. corporations.
Exporters and companies with a large interest in China are being targeted by sellers but tech high-flyers companies like Amazon (AMZN) and Netflix (NFLX) dragged the broader U.S. market to its longest slide in two years.
Another factor was the announcement from the International Monetary Fund that it cut its global growth forecast from 3.9% to 3.7% in 2018. Citing the recently enacted U.S. tariffs on Chinese goods and possible retaliation measures, the IMF also noted that U.S. asset valuations appear high, especially when factoring risks from further disruptions in trade policies.
Tracking the second-oldest U.S. market index, SPDR Dow Jones Industrial Average ETF (DIA ) is having a rough October so far, bleeding badly after it reached a record high last Wednesday. In just a week it lost 4.7% while still holding a positive number since the start of the year, 3.24% to date.
Sign up for ETFdb.com Pro and get access to real-time ratings on over 1,900 U.S.-listed ETFs.
Inverse Bonds Offer a Hedging Opportunity
As financial markets fall further and debt instruments continue to cause pain, investors have a chance to profit from this dismal environment though inverse bonds products. Inverse bonds ETFs are offering the opportunity to gain while the bond market declines and have attracted more viewers in recent days – an increase of 53% compared to the previous week.
The sustained bond sell-off pushed 10-year T-note yields to levels not seen in seven years and marked the largest daily jump since the U.S. presidential elections. On the other side of the Atlantic, fears of a war between Rome and Brussels over the Italian budget plan caused market jitters. The deficit-widening budget plan published two weeks ago rattled investors because it does not tackle the worrisome Italian debt pile, which – at about 130% of GDP – is second only to Greece.
With the Federal Reserve already raising rates three times this year, to a range of 2%-2.25%, and signaling another move in December, investors brace for a continuation in rising costs. Bonds could go lower or at least trade in this newly established range, with a tendency toward falling.
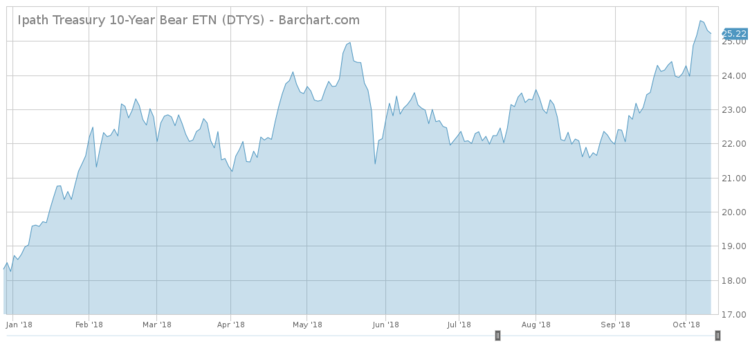
In such an environment, inverse bonds products like iPath US Treasury 10-year Bear Exchange Traded Note (DTYS ) seem like a good hedge. Offering inverse exposure to 10-year Treasuries, the ETN already staged a 10% run to 4-year highs over the last 30 days and a hefty 38% surge for the year.
Use our Head-to-Head Comparison tool to compare two ETFs such as (DIA ) and (DTYS ) on a variety of criteria such as performance, AUM, trading volume and expenses.
Japanese Assets Knocked
Surrounded by embattled markets, the Japanese exchange took a hit last week as the MSCI Asia Index, the broadest index of Asia-Pacific shares excluding Japan, touched 17-month lows. Japan’s Nikkei dived from 2018 highs on 4 consecutive sessions as its safe-haven currency was in demand as a consequence of a world market rout. Investors looked into Japanese assets for value as most view the recent drop as transitory, driving traffic up by 52% in the sector.
Japanese exporters were hit the hardest as both a rising yen and worries regarding the economic impacts of the Sino-American trade war dampened the initial optimism that took them to year highs. Auto companies like Toyota Motor and Honda Motor lost 8.2% and 11.5%, respectively, over the last seven trading days. Chip-related stocks were also hit by their American partners’ weakness, with Tokyo Electron tumbling 11.7% and Panasonic losing nearly 9% in Tokyo trading over the same period.
On a brighter note, capital expenditure in the world’s third-largest economy helped its GDP stage a comeback, marking the fastest growth pace in two years. With a 3% GDP expansion and both inflation and private consumption in check, the Asian economy shows signs of rejuvenation.
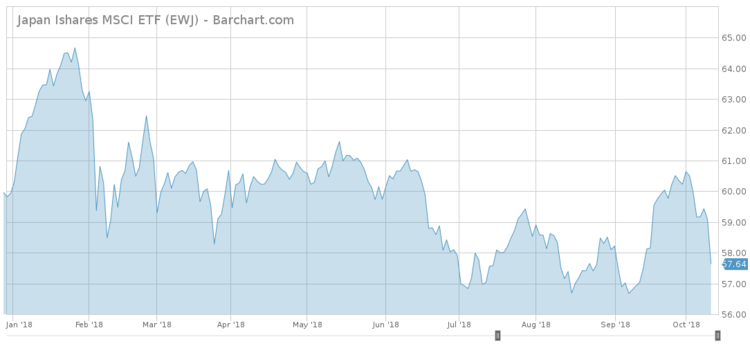
iShares MSCI Japan ETF (EWJ ) is the go-to product when considering investing in large-cap Japanese stocks. It can be an option for long-term portfolio risk balancing and the recent drop in prices could be an opportunity for those trying to gain exposure to the Asian economy. Since the start of the year, (EWJ ) lost 3.82%.
Crude Oil Pushed by Iran Sanctions
Oil notched up another weekly gain at the start of the month thanks to a fall in Iran’s crude exports. Traffic to the subject rose by 20% as investors tried to seek more information regarding the potential temporary imbalance in the oil market. Saudi Arabia and Russia have announced increases in production in order to make up for the expected disruptions from Iran, but that could take a few weeks.
Commodity traders first pushed WTI to four-year highs as analysts suggested a decline of nearly 60% in Iranian crude exports from 2.5 million barrels per day in April. In May, U.S. President Donald Trump withdrew the United States from a 2015 nuclear deal with Iran and restored sanctions. However, as news regarding some waivers on Iran crude sanctions surfaced, oil retraced. Oil rigs in the U.S. were cut by another two, to 861, for a third consecutive week.
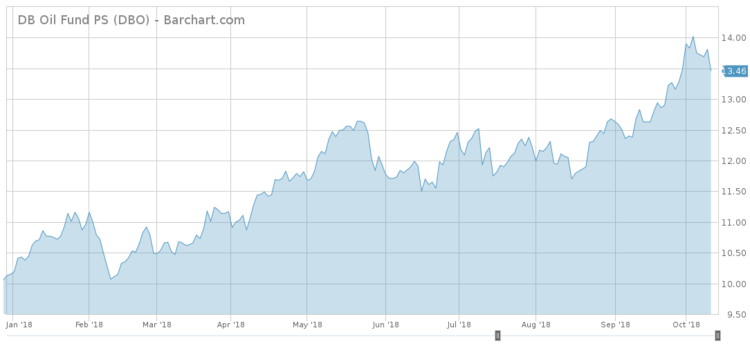
Finally, the global rout in financial markets took a toll on oil prices and crude inventories in the U.S. did not help either. U.S. oil inventories climbed 9.7 million barrels in the week ended October 5 to 410.7 million. Hurricane Michael knocked out 40% of U.S. Gulf of Mexico oil and that took the Invesco DB Oil Fund (DBO ) down to two-week lows. Despite the drop, the ETF holds ground at three-year highs with a 2018 rise of 32%.
For a deeper analysis on individual ETF investments such as (DBO ) or (EWJ ), use our ETF Analyzer tool. You can select ETFs by Category or Type as well as add individual ticker symbols to compare performance, expenses and dividend yield, among other metrics.
Canada and the New Trade Agreement
The newly named United States-Mexico-Canada Agreement brought hope to markets because it was a sign toward trade policy normalization from the U.S. administration. The trilateral agreement preserves a $1.2 trillion open-trade area that Canada depends on greatly. Interest in the sector rose by 13% as investors were widely expecting a deal.
Automotive tariffs will not apply to Mexico and Canada and so the 2.6 million autos from each country will be safe from U.S. levies. Steel and aluminum tariffs are yet to be negotiated but the agreement manages to impose stricter rules on intellectual property, labor and the environment. A sunset provision is built into the text allowing parties to review the deal every six years.
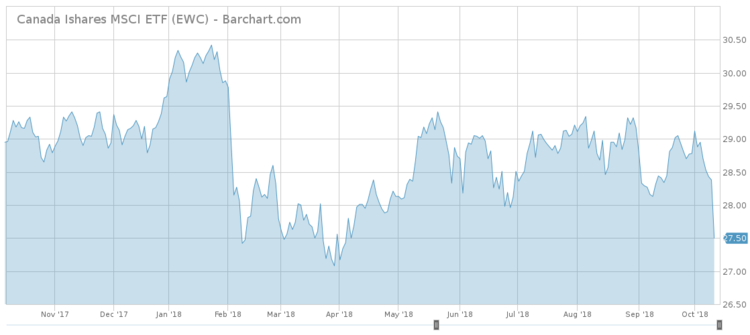
The deal offered Canadian assets a brief respite. The iShares MSCI Canada ETF (EWC ) reacted well and initially jumped by 1.2% but did not enjoy a calm environment and soon gave up the gains to slump below summer lows. After yesterday’s decline, it sits underwater by 7.2% for the year.
For more ETF news and analysis, subscribe to our free newsletter.
The Bottom Line
What started as a retracement from record highs in U.S. markets soon altered into a market rout that touched every corner of the financial world. A spike in U.S. Treasuries sparked the sell-off while investors flew to inverse bond products as a means to profit from declining prices in debt markets. Across the Pacific, Japan endures the washout in stocks while posting encouraging economic expansion. Lastly, crude oil and Canadian shares started the month on the right foot but soon gave in to market anxiety and outflows from risky assets.
By analyzing how you, our valued readers, search our property each week, we hope to uncover important trends that will help you understand how the market is behaving so you can fine-tune your investment strategy. At the end of the week, we’ll share these trends, giving you better insight into the relevant market events that will allow you to make more valuable decisions for your portfolio.

