
This is a special edition of the ETF Database scorecard that delves into the annual performance of some of the key funds. The performance is measured from January 1 to November 30.
- The trade spat between the U.S. and most of its economic partners has undoubtedly been the leitmotif of 2018. As such, President Donald Trump threatened to impose tariffs on goods and services imported from NAFTA companions Canada and Mexico, old allies from the European Union and its largest trade partner, China. All with the aim of reducing massive deficits and hopefully bring back lost jobs. First came the 30-50% levies on solar panels and washing machines, then the 25% on steel and 25% on aluminum and starting July the U.S. set a 25% tariff on $50 billion goods made in China. The November G20 meeting in Argentina helped curtail the rising anxiety that engulfed markets for the better part of October and November and sparked a relief rally in stocks and commodities. The deal struck on November 30 set a 90-day ceasefire period in which the U.S. would hold off from increasing and extending its tariffs on Chinese goods while the Asian economy would restart its purchases of agricultural goods.
- The U.S. central bank followed a hawkish path of rate hikes and raised three times so far this year – from 1.5% at the start of the year to a maximum of 2.25% set in September. Analysts expect a fourth hike in December as annual inflation runs at 2.5%, while the Federal Reserve’s preferred gauge, the core inflation, stands at 2.1%. At the same time, surging rates boosted 10-year Treasury yields to 7-year highs and caused headaches to indebted U.S. companies and emerging markets governments.
- Financial markets cheered the U.S. government bill that reduced taxes for companies and individuals and is projected to save them as much as $1.5 trillion over the next decade. Another impetus for stocks has been the $300 billion spending boost by the federal government passed in February.
Risk Appetite Review
- Markets experienced two major sell-offs and a consolidation period of five months. The S&P 500 rallied in January and made record highs in August and September only to give back those gains in October and now struggles to end the year on a positive note.
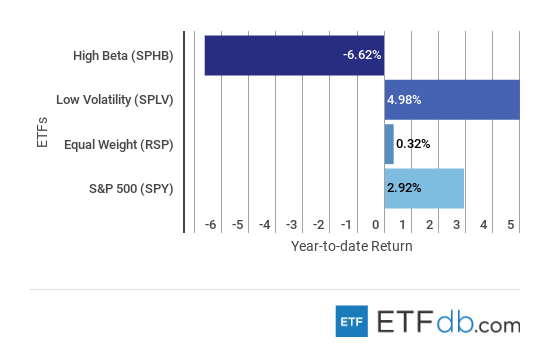
- Risk assets (SPHB ) fell the most in the list, by 6.62%. Tech companies like Netflix (NFLX) and Nvidia (NVDA) took down the ETF as both entered bear territory on lowered guidance and high valuations.
- On the other side, low volatility (SPLV ) mastered a 4.98% thanks to value corporations like Coca-Cola (KO), utilities businesses like Exelon (EXC) and Duke Energy (DUK).
- The broad market (SPY ) wrestled between positive and negative territory and ended the month of November with a gain of 2.92% year-to-date.
- The most-balanced ETF (RSP ), linked to the S&P 500, is a little above the water with 0.32% increase. The fund’s exposure approach has a value tilt with high industrials and real estate weightings.
Sign up for ETFdb.com Pro and get access to real-time ratings on over 1,900 U.S.-listed ETFs.
Major Index Review
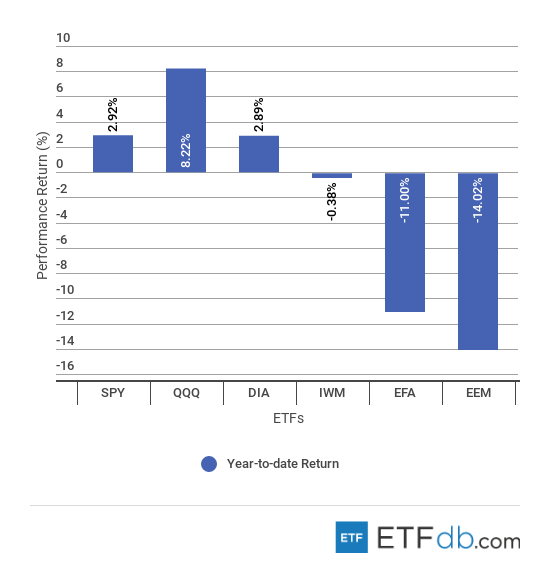
- Tech-heavy (QQQ ) is the best performer amongst its peers, having risen 8.22% in the past 11 months to November 30. The technology sector has been the star of the year, and although FAANGs dipped into bear market of late, the industry as a whole had a good year.
- Emerging markets (EEM ) were badly hurt by a strong dollar, rising interest rates and high debt burdens. The ETF dropped by 14.02% while prospects for 2019 do not look bright as funds continue to flee emerging markets in search of high returns and low risks.
- U.S. blue chips (DIA ) had a similar performance to the broader S&P 500 and gained 2.89% this year. While some components suffered from trade spats, others like Caterpillar (CAT) and companies like Boeing (BA) reported solid earnings.
- Small-Caps (IWM ) in the Russell 2000 Index are just shy of neutral for the year, down 0.38%. Risk tolerance dwindled after the February sell-off and so investors stayed away from these assets and rushed into safer plays.
- Non-U.S. developed markets (EFA ) were battered by outflows as investors preferred the U.S. market. The ETF with exposure to countries like Canada, Germany, France, Japan or Australia lost 11% because of low yields and political clashes.
To see how these indices performed a week before last, check out ETF Scorecard: December 7 Edition.
Sectors Review
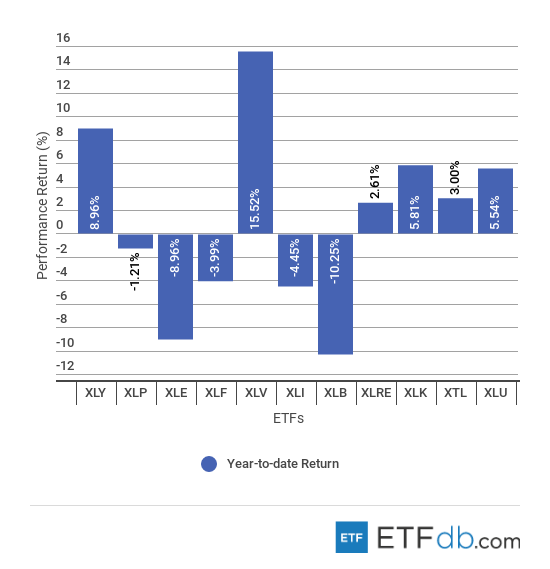
- Health care (XLV ) fared best and rose by 15.52% in the period January 2 to November 30. Medicare helped companies have a strong pricing model while membership growth and margins kept improving.
- Materials (XLB ) were at the other end of the spectrum as chemical giants DowDuPont (DWDP) and Linde (LNA), the ETFs top holdings, brought down its value by 10.25% in 2018. Linde, the world’s largest industrial gas company, merged with Praxair and created a $90 billion mammoth that lost 9% in value in its first 30 days of trading.
- For 2018, energy companies (XLE ) held onto gains until the massive October drop in oil prices. Energy Select Sector SPDR Fund lost almost 9% as the crude glut got worse and the U.S. reached record levels of production. Investors also feared a slowdown in global activity that would further hurt demand, as forecasted in International Energy Agency’s last two reports.
- Real estate (XLRE ) is up 2.61%, the sector being a “tariff-proof” investment that derives most of its revenues domestically. The sector has been benefiting from low inventory, steady pace of construction and rising homeownership for the 20-30-year-old age demographic.
- Utilities (XLU ) also performed well in 2018, climbing by 5.54%. Investors boosted the sector by adopting a defensive strategy in the face of global political risks. Analysts point to rising energy production and a value indicator that corrected from overvalued to fair price.
Use our Head-to-Head Comparison tool to compare two ETFs such as (XLE ) and (XLF ) on a variety of criteria such as performance, AUM, trading volume and expenses.
Foreign Equity Review
- Foreign equities were mostly down.
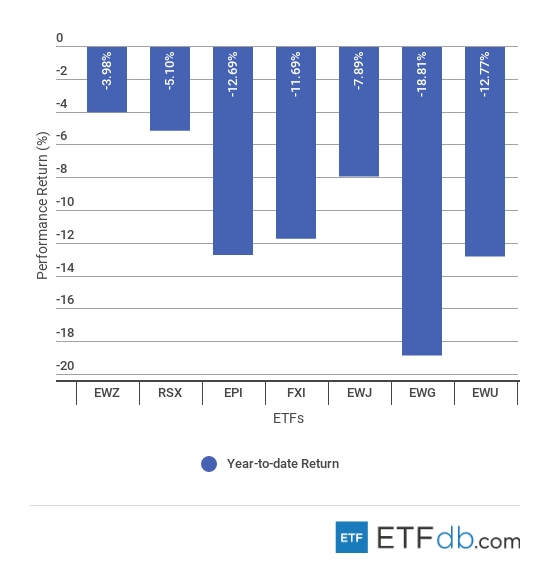
- Brazil (EWZ ) tops the list in which there are no performers. (EWZ ) has only lost close to 4% during the period as the economy struggles to bounce back after the worst recession on record. Brazil’s new president is expected to deliver on his pro-market reforms like privatizations and a new pension system that will be more friendly to the country’s fiscal problem.
- Germany (EWG ) ranks at the bottom of the list with a negative 18.81% for 2018. The country bore the brunt of Trump’s car tariff threats and a slowdown in economic activity in the European Union, as well as low consumption within its borders.
- India (EPI ) is also in the red for 2018, having fallen 12.69%. Rising fuel prices led to spiraling inflation, which, in turn, hit the brakes in GDP growth from 8.2% to 7.1% for the third quarter. Its currency, the rupee, made several record lows against the dollar during 2018.
- China (FXI ) was unsurprisingly beaten down by investors as a result of continuous trade jitters. Adding to that, the ETF slipped 11.69% as worries regarding high debt levels and overcapacity made investors look the other way when considering placing funds into products with exposure to the Asian giant.
To find out more about ETFs exposed to particular countries, check out our ETF Country Exposure tool. Select a particular country from a world map and get a list of all ETFs tracking your pick.
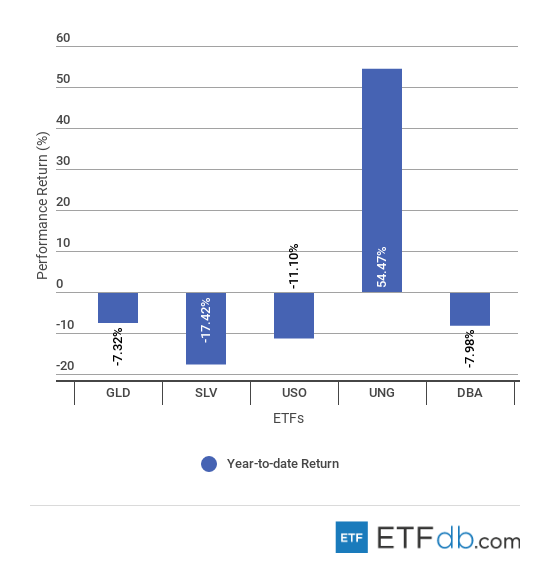
Commodities Review
- Commodities had a sole winner – natural gas.
- Natural gas (UNG ) outshined all other commodities with a 54.47% gain in 2018. Natural gas spiked in November on a combination of unexpected cold weather and reduced stocks. The U.S. storage facilities held the lowest quantities of natural gas in 15 years for the November period. The commodity was also propelled by leveraged positions being closed on margin calls.
- Silver (SLV ) was hit by the strong U.S. dollar and, although widely used in the automotive and technologies sectors, it shed by 17.42% of its value. The consensus is that silver prices will rise with higher industrial demand and a cooldown of the U.S. stock market that is attracting most funds that were once guided to metals.
- Oil (USO ) plunged by 11.1%, brought down by record U.S. production and surging stockpiles. Crude is set to stabilize in December once OPEC, along with Russia, decides upon supply cuts large enough to stem glut worries.
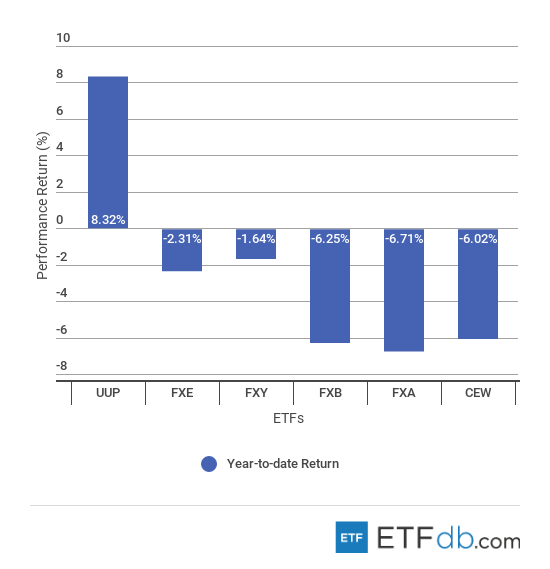
Currency Review
- The greenback (UUP ) topped the list as rising interest rates and a hawkish monetary policy pushed up the dollar by 8.32%. Despite a 18% swell of U.S. budget deficit and another 17% projected for the next year, the U.S. dollar continues to outmaneuver other currencies as investors are seeking the one that yields the most and is regarded as safest.
- The Australian dollar (FXA ) fell the most, by 6.71%, and hit a 32-month low in October. Seen as a proxy to emerging markets currencies, it sold off mainly because of the interest rate differential between the region and the U.S. As the Fed hiked three times in 2018, Australia’s Reserve Bank kept interest rates at 1.5% for more than two years.
- The British pound (FXB ) had a messy year and came close to ending it in last position. The ETF with exposure to the British currency lost 6.25% on the back of a painful negotiation process with the EU regarding Brexit. Mostly, the slowdown in inflation and economic activity came as a result of immense uncertainty for both the business environment and households.
- WisdomTree Emerging Currency Fund (CEW ) covers embattled currencies like the Brazilian real, which lost 16.3% in value from January 2 to November 30, and the Turkish lira, which dived 36.5% over the same period. The lira plunged as President Recep Tayyip Erdogan opposed rate hikes that were meant to support the currency. He feared that the massive $300 billion dollar-denominated corporate debt would be too much of a burden for the economy. Inflation also spiked to 15.39% in August, the highest annual rate in 18 years.
For more ETF news and analysis, subscribe to our free newsletter.
Disclosure: No positions at time of writing.

