Advisors often must undertake the unenvious task of constructing a portfolio. That includes deciding between indexed funds, active funds, or a mix thereof. S&P discussed this conundrum in their latest SPIVA report, Heroes in Haystacks: Index Comparisons for Active Portfolio Performance.
The task would be simple if, for instance, one fund was selected for equities allocation and another for fixed income. However, portfolio construction is much more complex. Like a general manager of a professional sports team tasked with constructing a competent franchise, advisors must sift through the mass of funds and building a portfolio that ultimately generates positive alpha. That includes making the choice between active or passive funds.
“Individual active funds are rarely chosen in isolation; instead, they are more often selected as a component within a broader portfolio of funds representing different styles and asset classes,” the report confirmed. “Some of these may be active funds, others may be passive.”
Active Underperformance and Volatility
Again, like a professional sports GM examining performance statistics, thankfully S&P releases SPIVA scorecards that offer a window into the performance of active funds. Even then, advisors must discern whether an active fund’s performance resulted from skill or luck before recommending a fund to a client. S&P said it best in a Persistence Scorecard earlier this year: “Skill is likely to persist, but luck is ephemeral.”
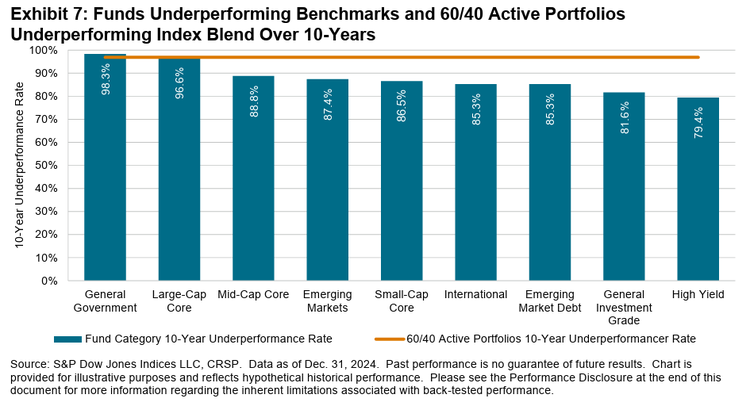
That said, the findings of the report still show that outperforming indexes is a difficult undertaking based on S&P’s simulation testing across various assets. Moreover, they used the 60-40 portfolio as the primary basis of comparison. The results further show that active funds tend to exhibit heavier volatility over a 10-year performance timeframe. That’s in addition to underperforming.
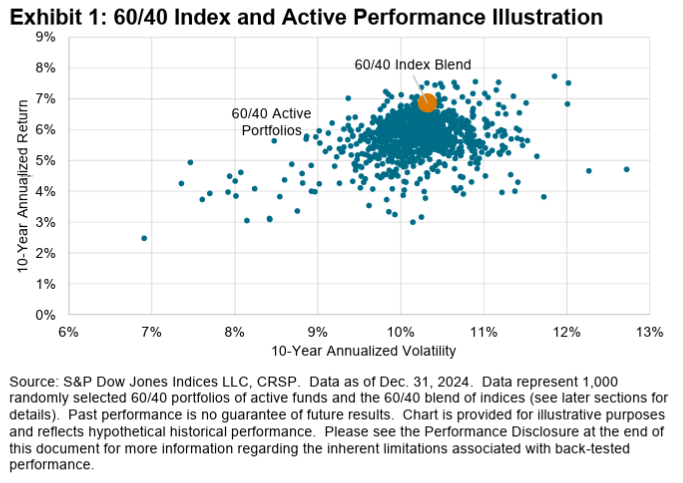
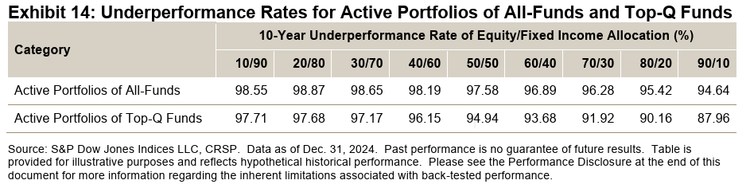
“In this special report, we compare theoretical multi-asset portfolios of active funds to weighted blends of indices, finding that 96.9% of 60/40 portfolios of active funds would have underperformed equivalent blends of indices over 10 years,” S&P noted. “In many cases, portfolios of active funds not only produced lower performance, but also generated higher volatility (see Exhibit 1).”
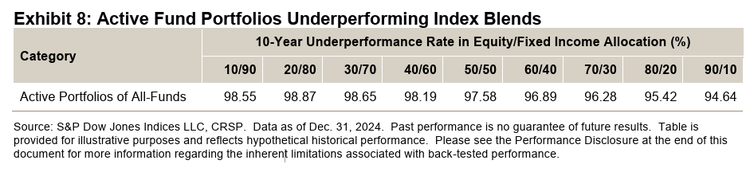
Alongside the 60-40 portfolio, S&P used various derivations of portfolio allocation. They tested 70-30 portfolios that skew more towards equities to more extreme 10-90 examples that tilt heavily towards fixed income. Ultimately, it didn’t alter the results in favor of active performance.
Narrowing the Field
Even with the proper tools to assess performance figures, advisors can still select funds that produce middling performance in the long-term. It falls in line with the common disclaimer that past results aren’t accurate prognosticators of future performance.
“Over the years, SPIVA Persistence Scorecards have shown just how difficult it is to predict future performance based on past results, as many outperforming active funds tend to mean-revert over time,” the report said.
One option advisors may consider is limiting active fund selection to the cream of the crop. Nonetheless, S&P’s simulations still revealed underperformance in the top-quartile funds, but at least to a lesser degree versus the entire field. This was the same for traditional 60-40 portfolios to less traditional 10-90 portfolios.
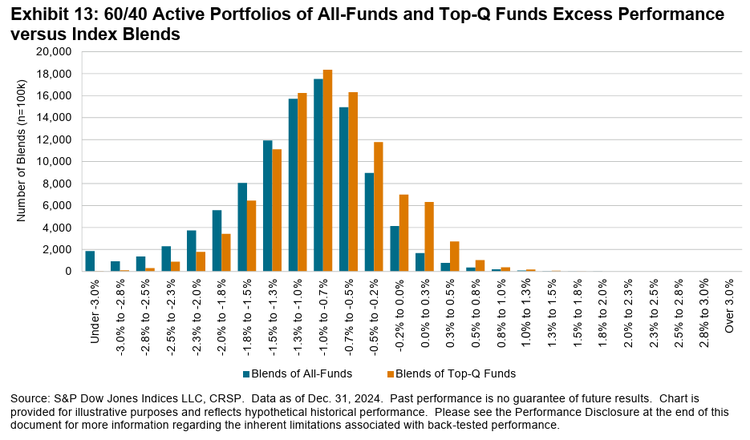
“Discovering that even portfolios comprised solely from prior top-quartile funds still failed to outperform blends of indices with high probability, we are left wondering what characteristics define the small sliver of winning portfolios,” the report said. “A narrower fund selection universe than prior top quartile funds is at least required.”
Key Takeaways
In the end, S&P’s report further confirmed that actively outperforming an index is still a mix of art and science, benefitting from a tablespoon of luck. Underperforming funds continue to do so at a higher rate compared to blends of indexes. Again, results didn’t vary between traditional 60-40 all the way to 10-90 portfolio allocations. Choosing the best-performing funds in the top quartile also didn’t dramatically improve underperformance rates in the long-term horizon. Also, some active funds in fixed income that were top-quartile performers in generating returns exhibited greater risk in subsequent time periods.
With de-dollarization trends translating into a weaker greenback recently, more advisors are steering investors towards international funds. The report did reveal that it was easier to identify and ultimately select the top performers within this category.
“Among portfolios employing a skillful (or lucky) selection process for active funds in one category with a passive approach in other categories, the identification of outperformers among International Funds offered the highest positive impact at the portfolio level,” the report noted.
For a more comprehensive explanation of the methodologies used to derive the results and more importantly, for advisors to formulate their own takeaways, it’s best to view the report in its entirety here.
Originally published on Advisor Perspectives
For more news, information, and strategy, visit ETFdb.

