
In motorsports, fine-tuning and micro-tweaking of an engine can help extract the added performance necessary to win a race. In the case of the Xtrackers S&P 500 Scored & Screened ETF (SNPE ), it’s addition by subtraction. The fund is able to outperform the S&P 500 by excluding companies that don’t meet their screening criteria.
The fund underwent a rebranding last year, dropping the “ESG” tag to comply with naming convention rules under the European Securities and Markets Authority (ESMA) and UK’s Sustainability Disclosure Regulations (SDR). While the exterior may have changed, the engine underneath the hood is still a high-performing S&P 500 Scored & Screened Index.
The fund underwent a rebranding last year, dropping the “ESG” tag to comply with naming convention rules. While the exterior may have changed, the engine underneath the hood is still a high-performing S&P 500 Scored & Screened Index.
Key Takeaways:
- Dropping the ESG from its name to align with regulatory naming conventions has successfully revived investor interest in SNPE, causing net flows to more than double year-over-year.
- Selective scoring and screening acts as addition by subtraction, paring the portfolio down to 330 names and giving the fund a leaner, higher-conviction chassis than VOO.
- Tactical concentration in top-performing secular winners like NVIDIA has effectively supercharged the fund, allowing it to consistently outpace broader market-cap-weighted benchmarks.
See More: DWS: A Long History of Differentiation
In Pole Position
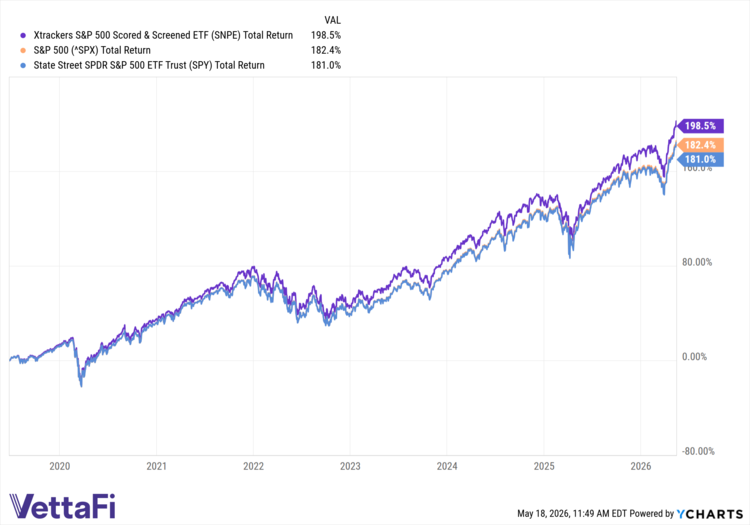
Since its inception in the summer of 2019, SNPE has been in pole position when comparing total returns to the broader S&P 500. The fund is up almost 200%, which is outpacing not only the S&P 500 Index, but also the State Street SPDR S&P 500 ETF (SPY ).
As mentioned, its screening methodology is what differentiates it from the broader index. It selects constituent companies from the S&P 500 Index while applying systematic sustainability filters. It excludes companies that lack an S&P Global ESG score or rank in the bottom 25% of their GICS Industry Group.
Additionally, stringent criteria involves the exclusion of companies linked to tobacco production or distribution, controversial weapons, small arms, military hardware, thermal coal operations, and oil sands extraction based on specific revenue or ownership thresholds. Finally, companies deemed non-compliant with United Nations Global Compact (UNGC) principles regarding human rights, labor, environment, and anti-corruption by Sustainalytics data are excluded.
Double the Flows
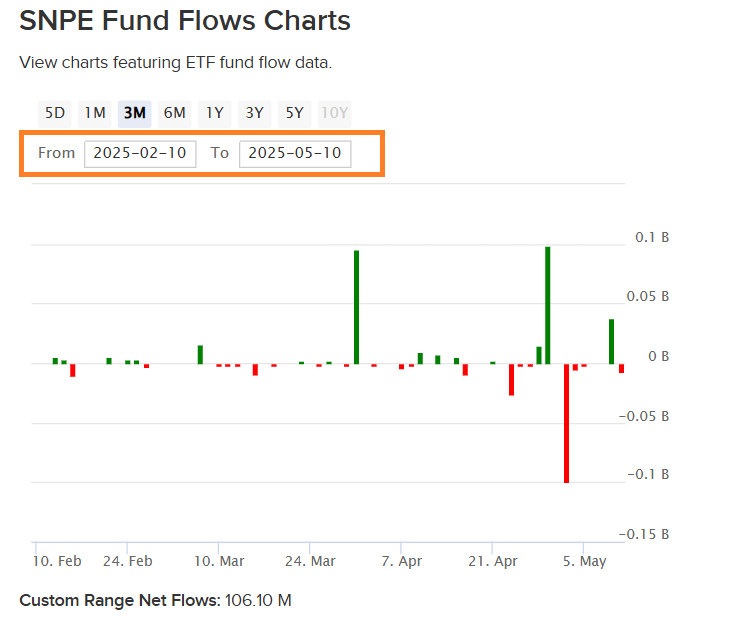
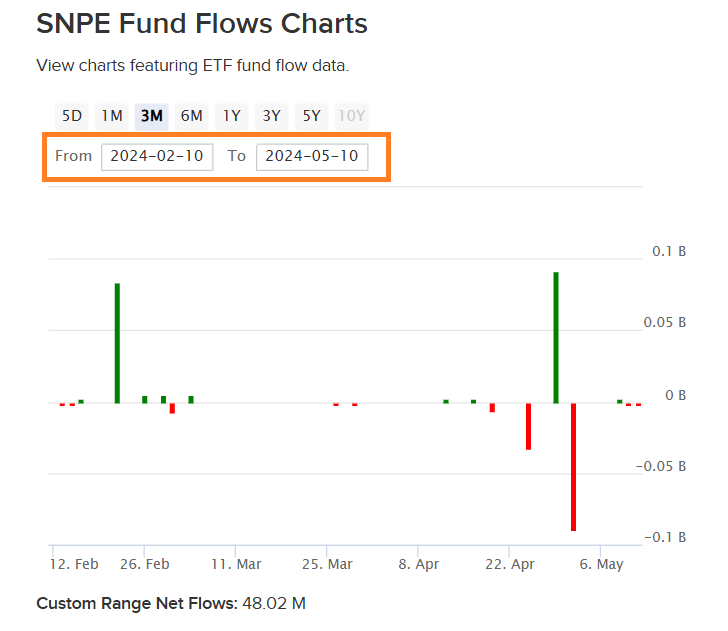
The interest is even further punctuated when comparing the net flows from the same time to the year before. That said, the three-month period in the net flows after the rebrand more than doubled compared to the same three-month period in 2024.
The fund’s net assets currently sit at roughly $2.8 billion based on data from ETF Database. Supported by a competitive expense ratio of just 0.10%, this pricing puts it within striking distance of other core equities ETFs like SPY and even the vaunted Vanguard S&P 500 ETF (VOO ).
SNPE Holdings Versus VOO
Compared to VOO, there’s a 61% overlap with SNPE, but that 39% differentiation is what sets the two funds apart. Again, the screening methodology highlights what SNPE doesn’t own. Once again, analogous to motorsports, it’s similar to SNPE having a lighter chassis to extract greater performance.
Unlike broad exposure to the S&P 500 (VOO) via a typical market cap-weighted approach, SNPE’s proprietary methodology showcases a leaner, high-conviction portfolio. The holdings analysis reveals a clear structural contrast between the two funds based on TMX VettaFi’s index metrics. While VOO tracks the broad index with 503 holdings, SNPE’s scoring and screening filters reduce its portfolio to a leaner 330 holdings.
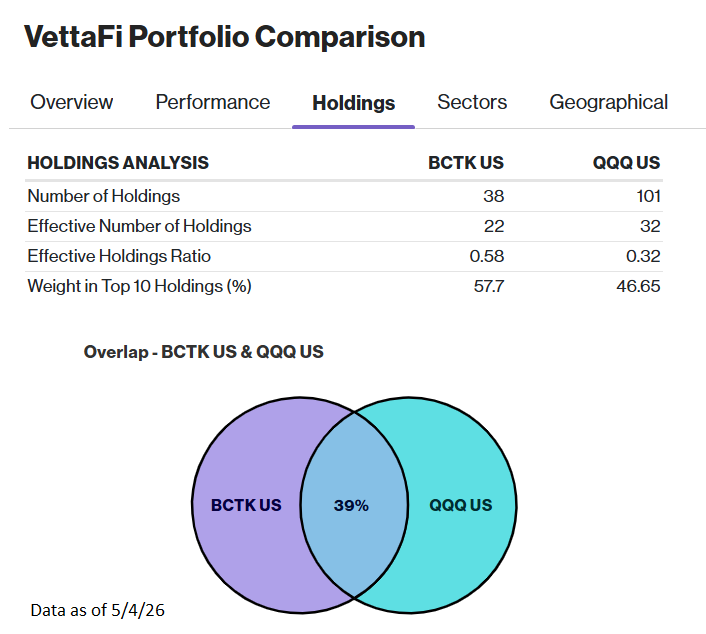
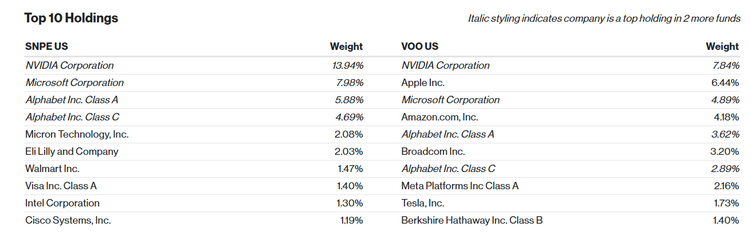
SNPE’s methodology makes the fund notably more concentrated. The high conviction is apparent with its effective number of holdings dropping to 28 compared to VOO’s 48. Consequently, SNPE carries a lower effective holdings ratio of 0.08 versus VOO’s 0.10. This deliberate concentration is most evident at the top of the portfolio, where SNPE features a higher weight in top 10 holdings of 41.93%, compared to VOO’s 38.35%.
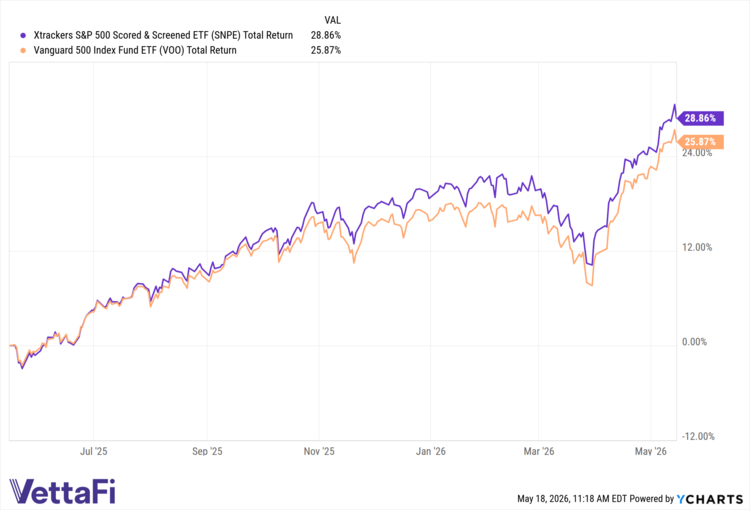
How is this translating to performance? Within the past year, SNPE has been outpacing the more popular VOO.
NVIDIA: SNPE's Nitrous Oxide
Furthermore, SNPE’s methodology significantly overweights its portfolio to structural secular winners. To this point, the fund allocates a 13.94% to NVIDIA Corporation by nearly doubling VOO’s 7.84% stake in the chipmaker. This higher concentration allows SNPE to capture more upside from dominant market leaders like NVIDIA compared to the broader index.
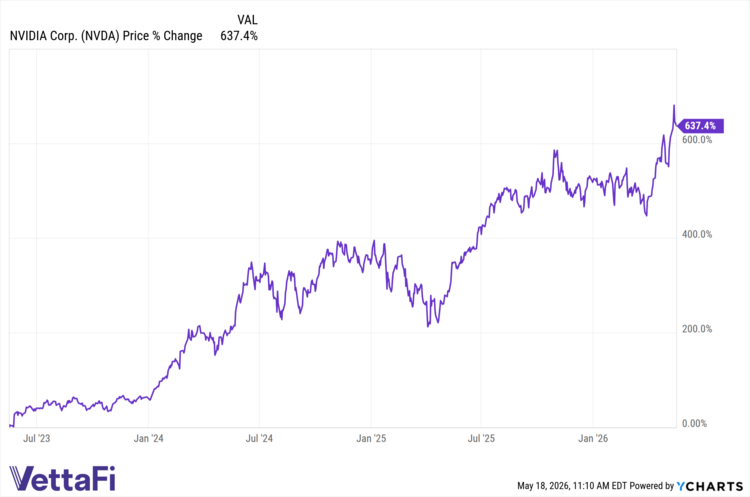
In the case of NVIDIA, it’s akin to adding nitrous oxide to a combustion engine. The chip-making giant has returned over 600% within the last three years, substantiating its higher weight in SNPE.
Taking the Checkered Flag
SNPE’s long-term performance relative to the broader S&P speaks for itself. By shedding its legacy drag and leaning into a lighter, high-conviction chassis, SNPE proves that addition by subtraction can be a winning formula when the proverbial rubber meets the road.
With a competitive 0.10% fee, doubled inflow velocity, and a supercharged overweight to secular winners like NVIDIA, this refined vehicle is built to outpace the standard S&P 500.
| Feature | Xtrackers S&P 500 Scored & Screened ETF | Vanguard S&P 500 ETF |
|---|---|---|
| Ticker | SNPE | VOO |
| Issuer | DWS / Xtrackers | Vanguard |
| Inception Date | June 25, 2019 | September 7, 2010 |
| Expense Ratio | 0.10% | 0.03% |
| Underlying Index | S&P 500 Scored & Screened Index | S&P 500 Index |
| Total Number of Holdings | ~330 | ~503 |
| Key Exclusions / Differences | Excludes lowest 25% ESG scorers per industry, tobacco, controversial weapons, thermal coal, and non-compliant UNGC firms. | Full market-cap representation of the broad S&P 500 universe without qualitative filters. |
For more news, information, and strategy, visit VettaFi | ETFDB.

